OpenShift Data Foundation Stretched Metro Cluster (UI)
1. Overview
The intent of this solution guide is to detail the steps and commands necessary to deploy OpenShift Data Foundation
(ODF) in Arbiter mode using the OCP Web Console and test different failure scenarios.
In this module you will be using OpenShift Container Platform (OCP) 4.x and the ODF operator to deploy ODF in Arbiter mode.
2. Production Environment Requirements
As a reminder here is the list of requirements for production environments:
-
One OCP 4.7 (or greater) cluster
-
OpenShift Data Foundation(ODF) 4.7 (or greater) -
Two (2) failure domains for OSD deployment
-
At least two (2) nodes in each availability zone
-
LSO is a requirement for UI deployment
-
-
One (1) failure domain for Monitor Arbiter deployment
-
Arbiter Monitor can natively run on a master node
-
3. Prepare OCP Environment
3.1. Scale ODF Nodes
3.1.1. Two Worker node cluster
Confirm your environment only has 2 worker nodes.
Once you are logged in, navigate to the Compute → MachineSets menu.
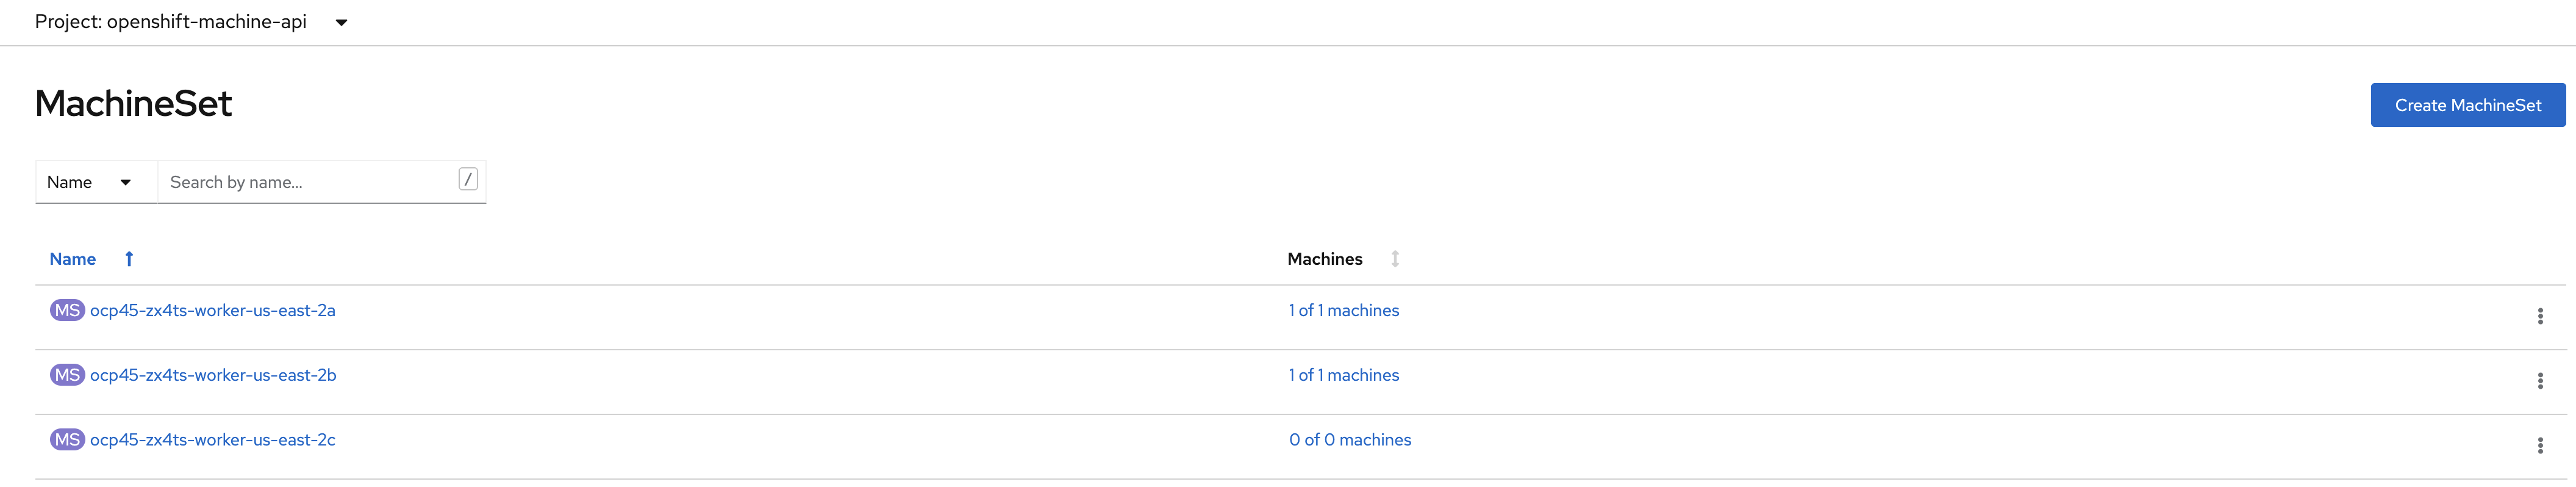
If your cluster has worker nodes deployed in your third availability zone skip to
chapter Three Worker node cluster. This is the case
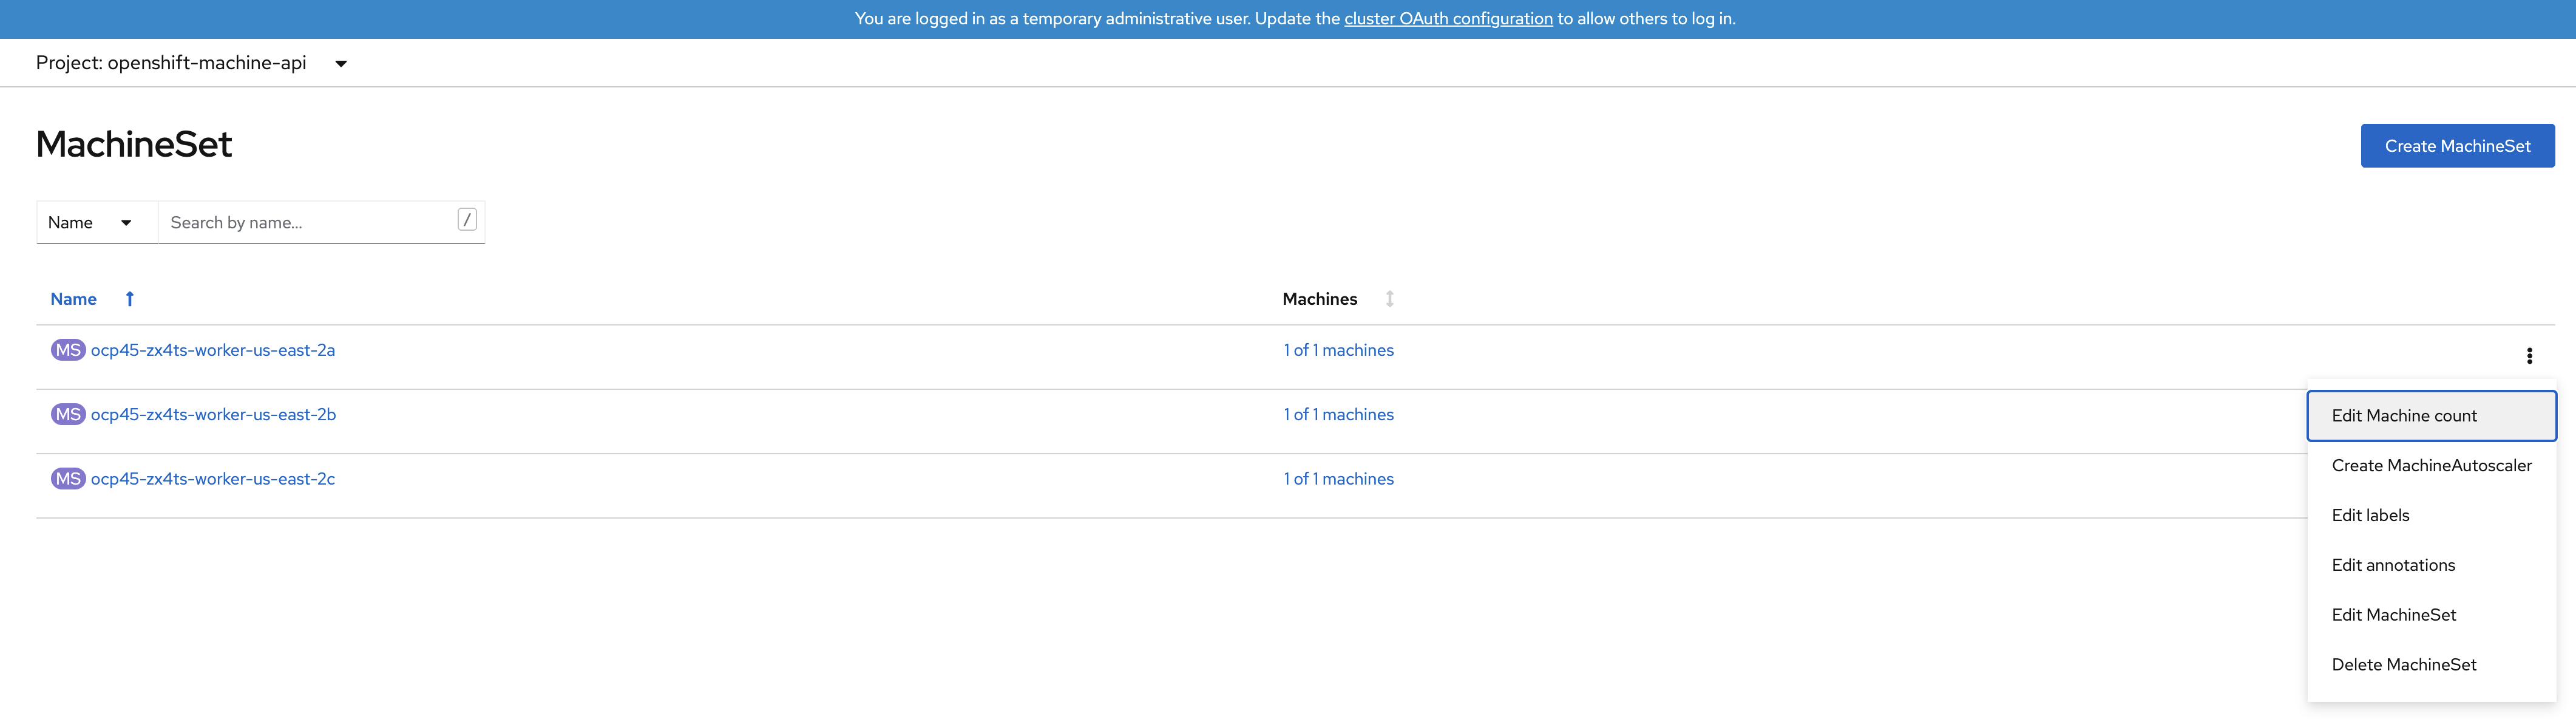
when all MachineSets show 1 of 1 machines.
|
Click the 3 dot icon on the right hand-side of the window for the MachineSet
in zone us-east-2a.
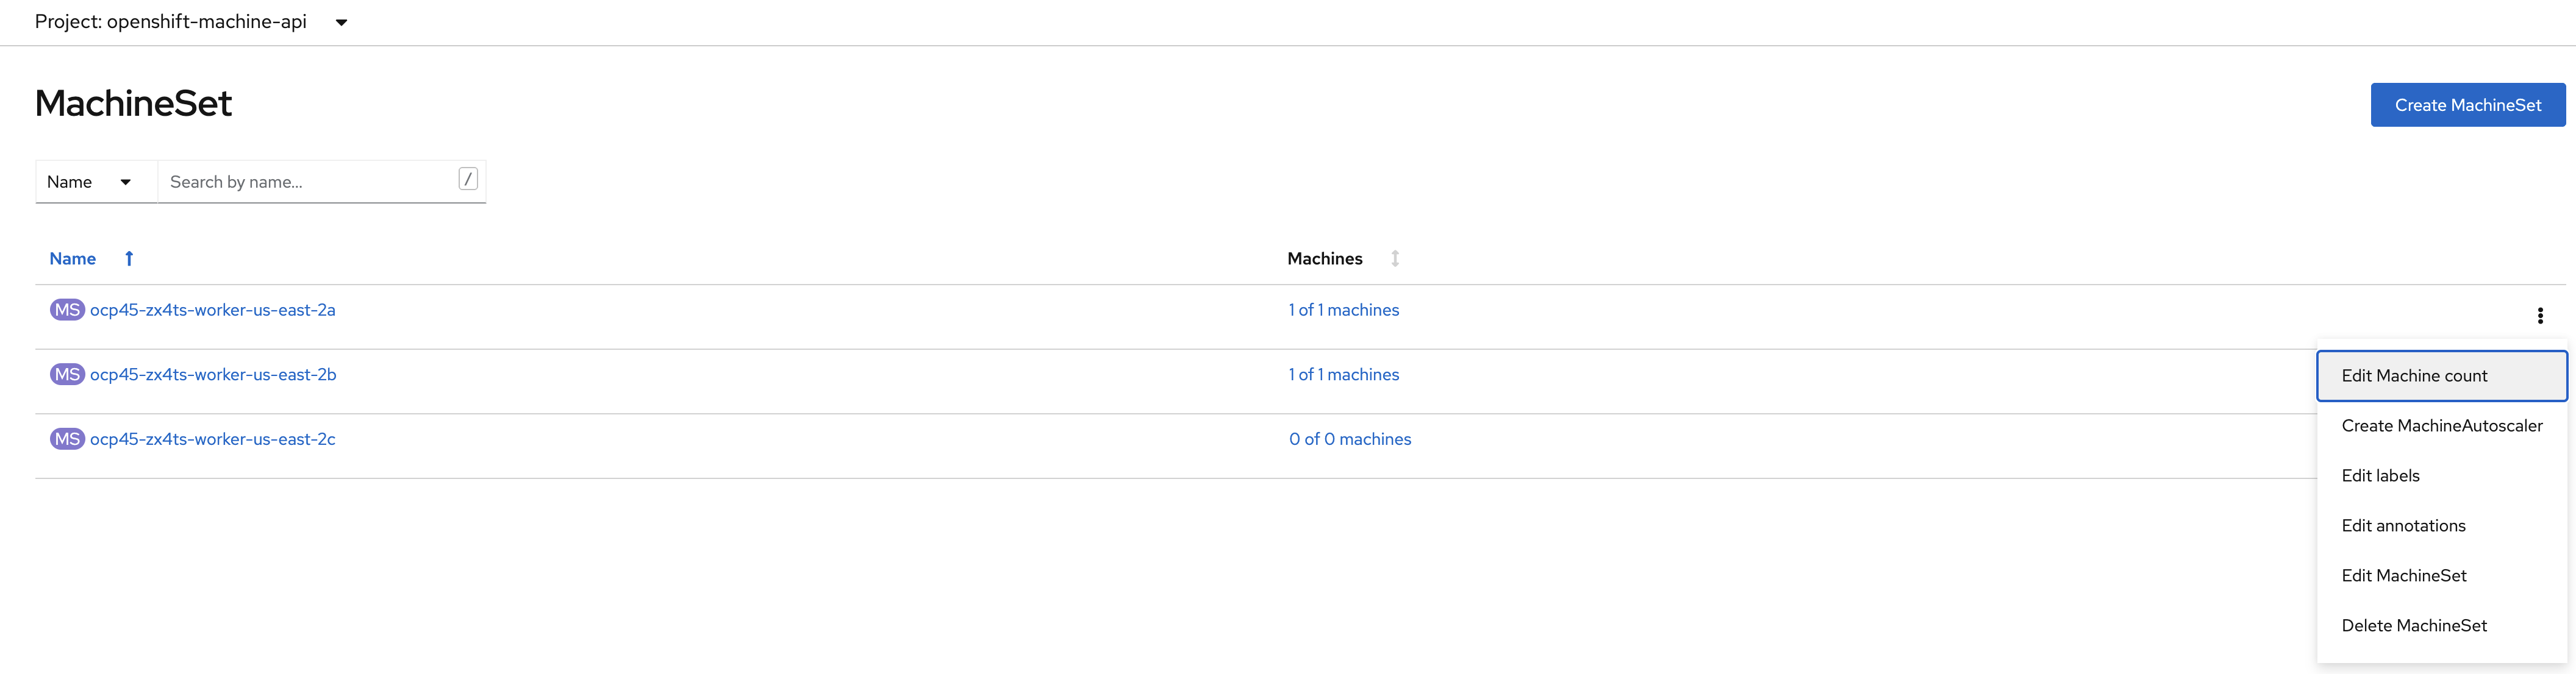
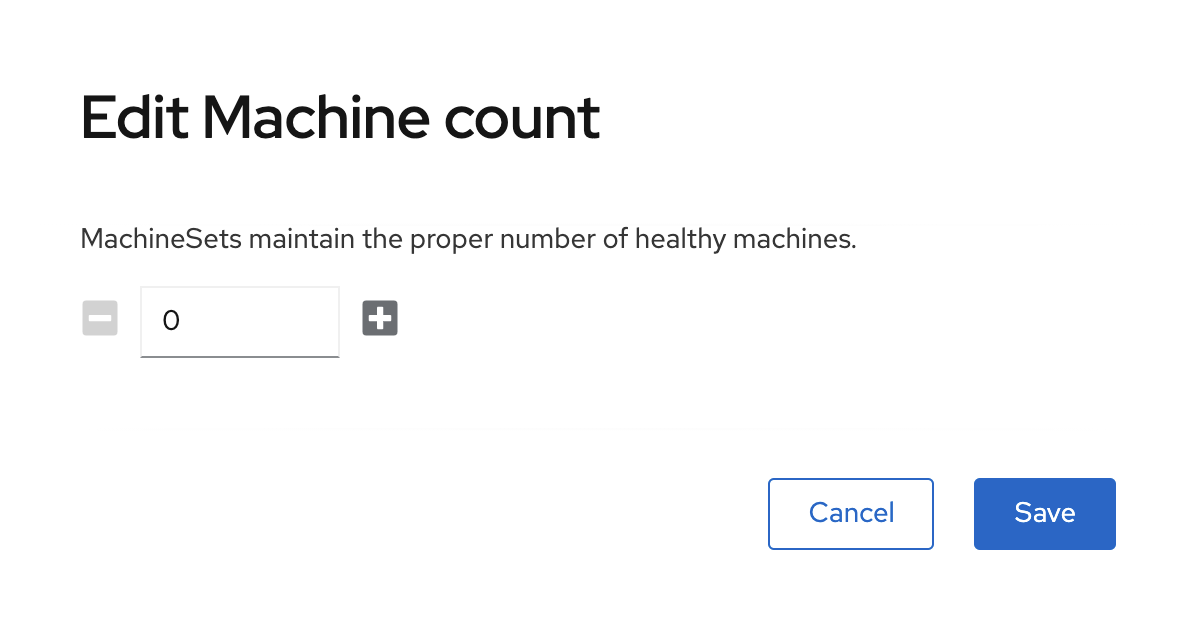
Select Edit Machine count.
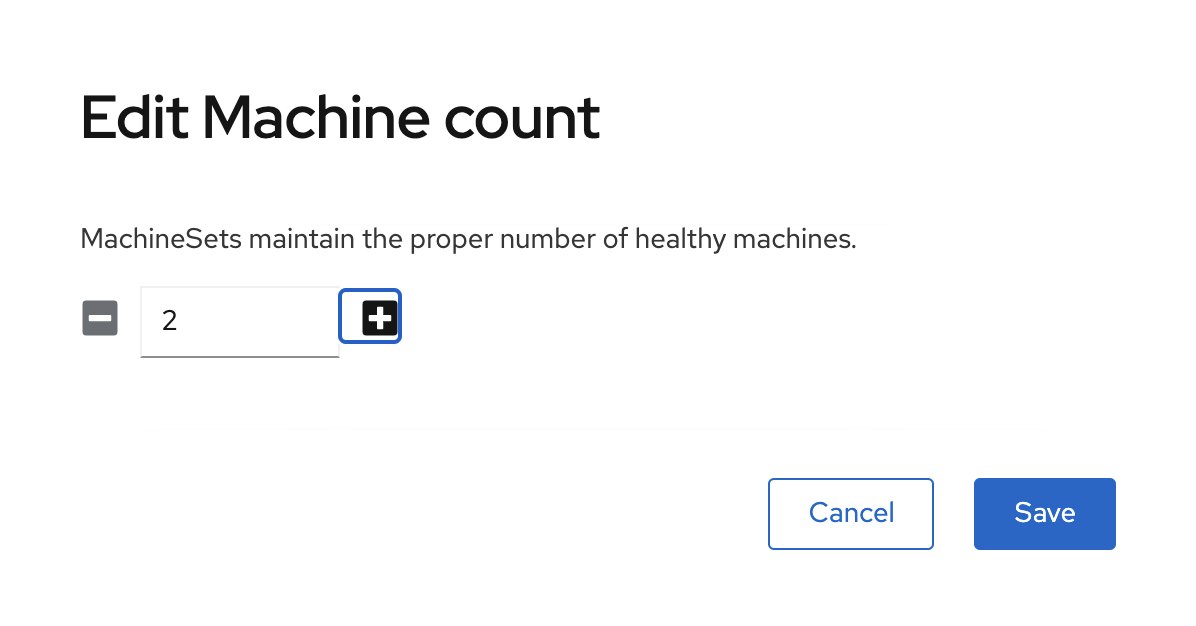
Increase the machine count to 2 using the + sign and click Save.
Repeat the scaling operation for the MachineSet in zone us-east-2b.
|
Do NOT scale the MachineSet in zone us-east-2c.
|
A minimum of 2 nodes per storage availability zone is a requirement for Arbiter mode deployment.
| Go to chapter Proceed With Setup. |
3.1.2. Three Worker node cluster
Confirm your environment has 3 worker nodes.
Once you are logged in, navigate to the Compute → MachineSets menu.
Click the 3 dot icon on the right hand-side of the window for the MachineSet
in zone us-east-2a.
Select Edit Machine count.
Click the + sign up to 2 and click Save.
Repeat the scaling operation for the MachineSet in zone us-east-2b.
|
Scale down the MachineSet in zone us-east-2c to 0.
|
Click the 3 dot icon on the right hand-side of the window for the MachineSet
in zone us-east-2c and select Edit Machine count.
0Click the - sign down to 0 and click Save.
| A minimum of 2 nodes per storage availability zone is a requirement for Arbiter mode deployment. |
3.1.3. Proceed With Setup
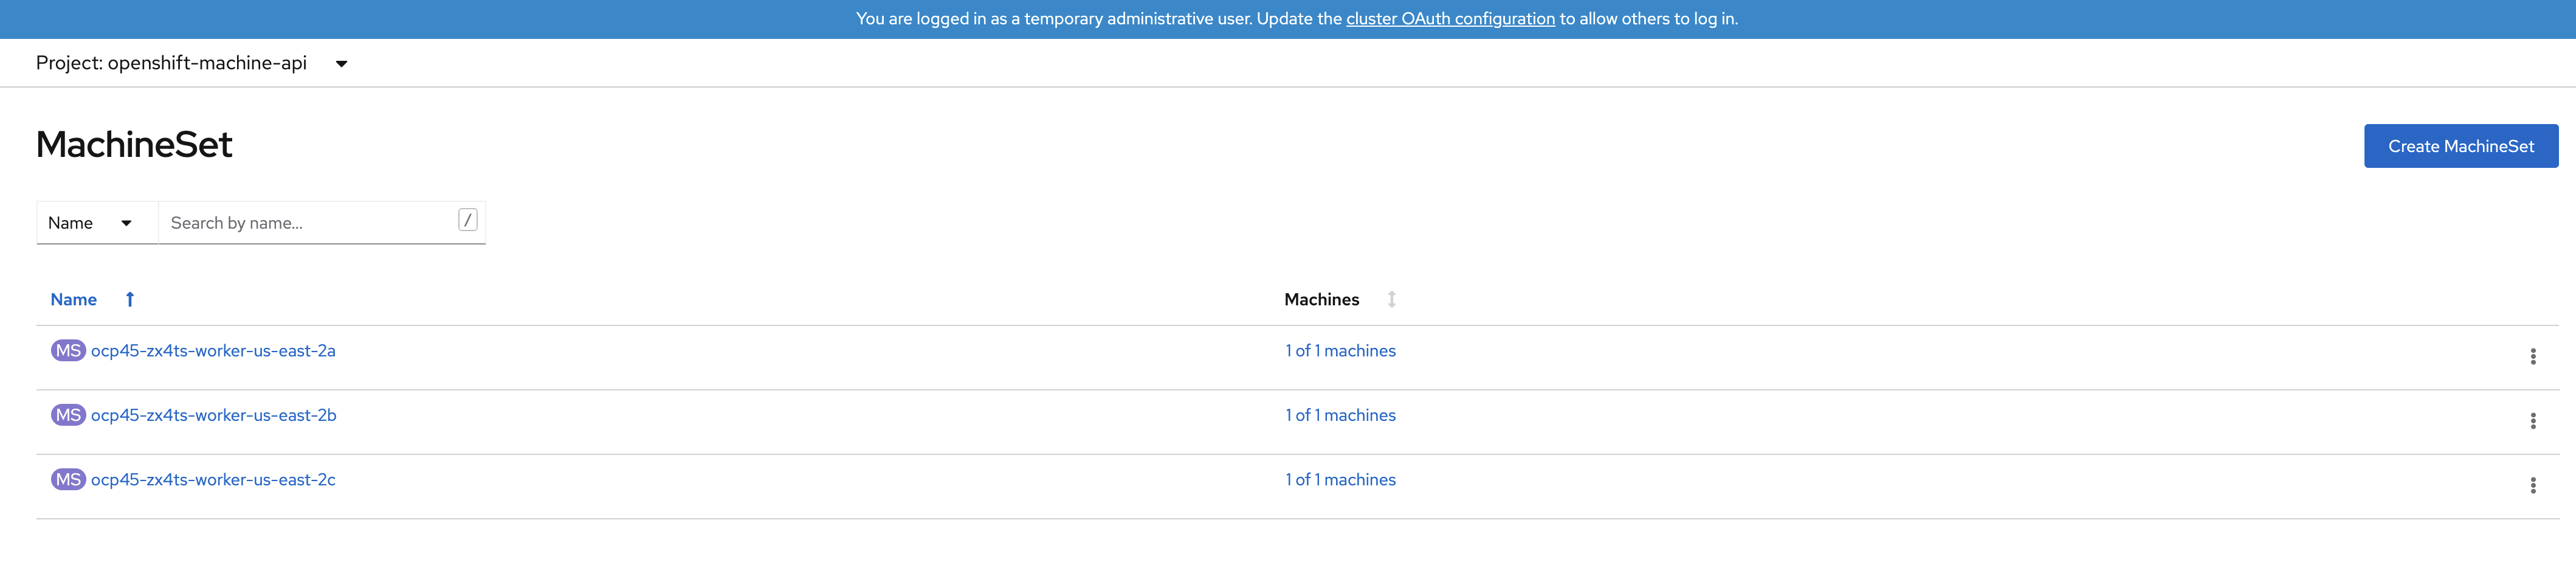
The scaling operation could take more than 5 minutes. The result of this command needs to
look like below before you proceed. Your configuration is ready when the MachineSet
UI show 2 of 2 machines for zone us-east-2a and us-east-2b as illustrated below.
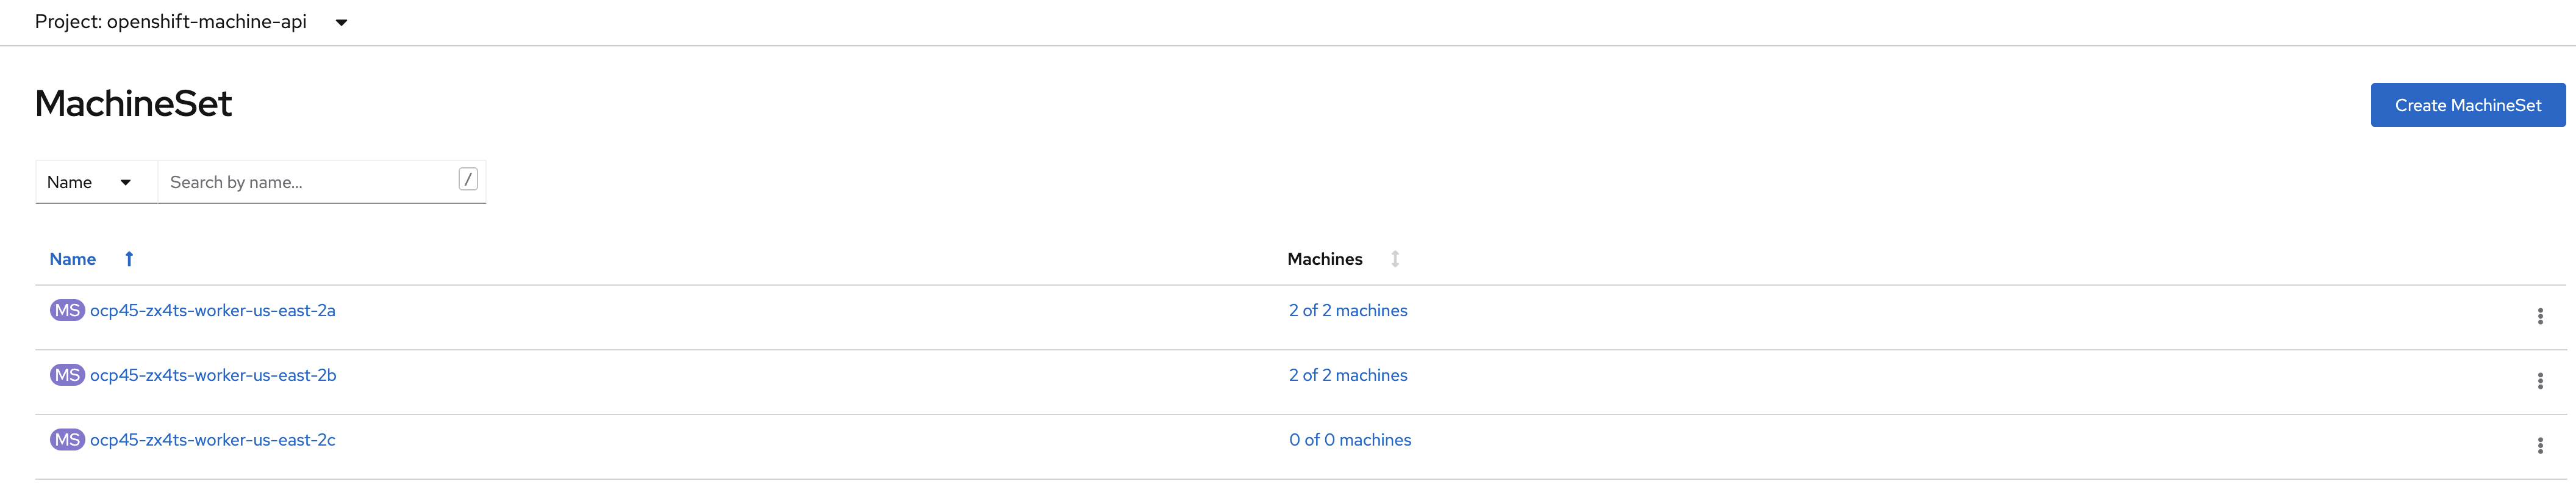
| The total number of worker nodes should be 4. |
Navigate to the Compute → Nodes menu.
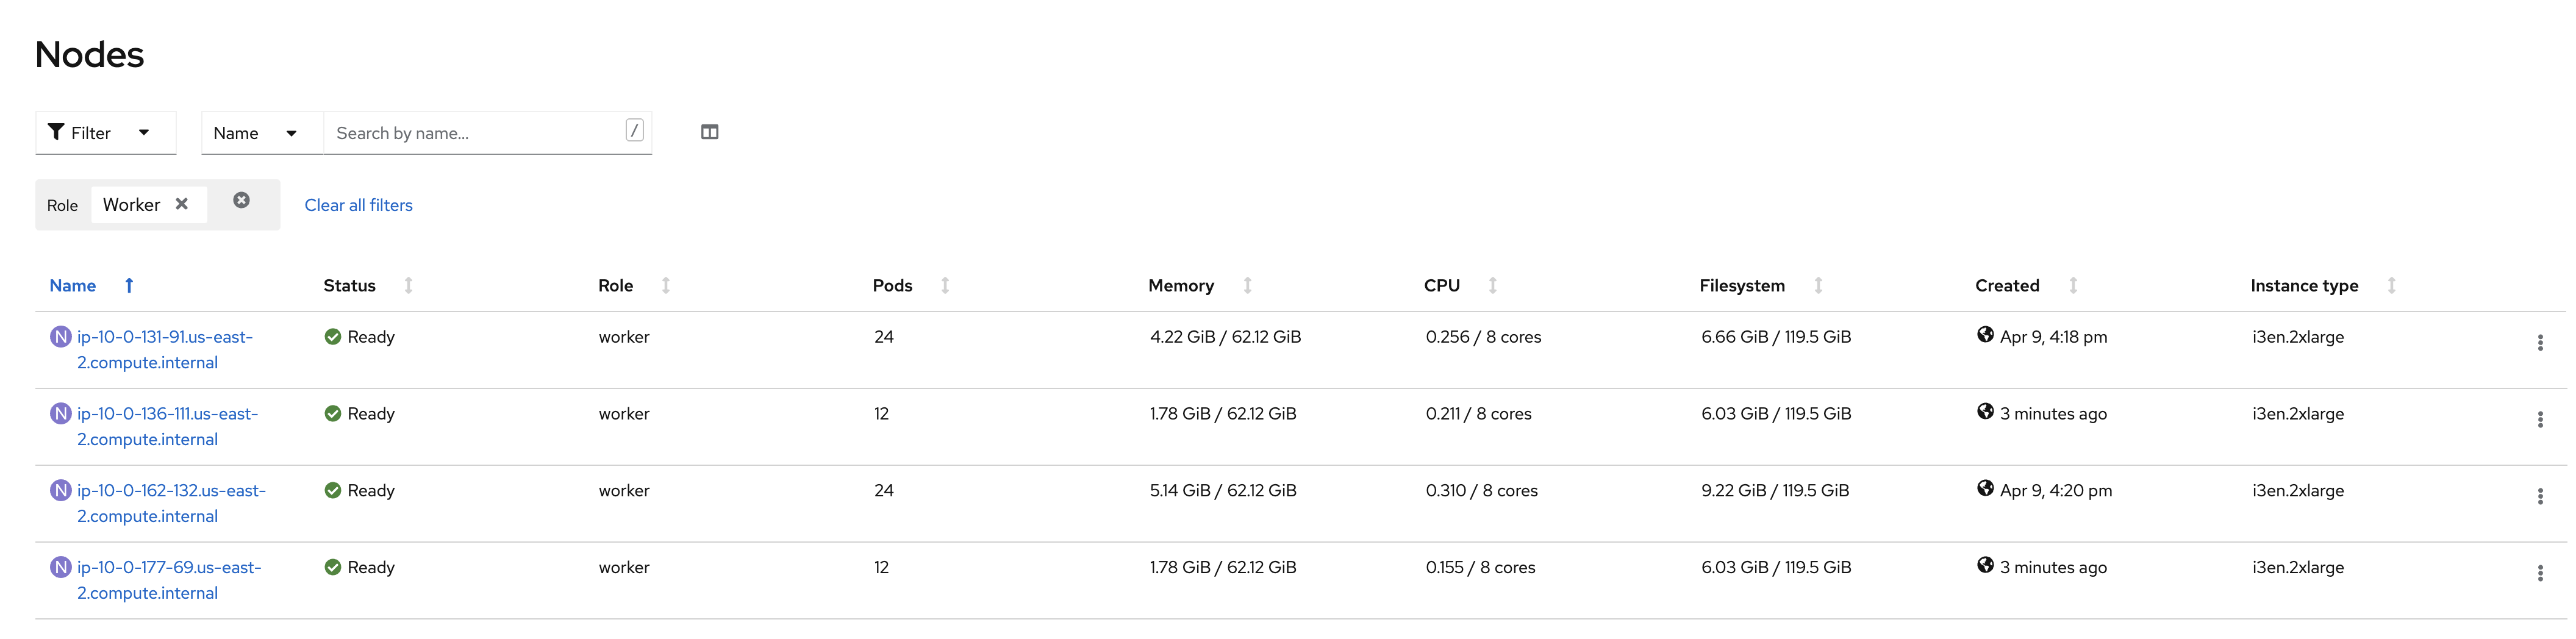
Filter to visualize only the worker nodes. You UI should present only four (4) worker nodes as illustrated above.
4. Local Storage Operator
4.1. Installing the Local Storage Operator v4.7
Once you are logged in, navigate to the Operators → OperatorHub menu.
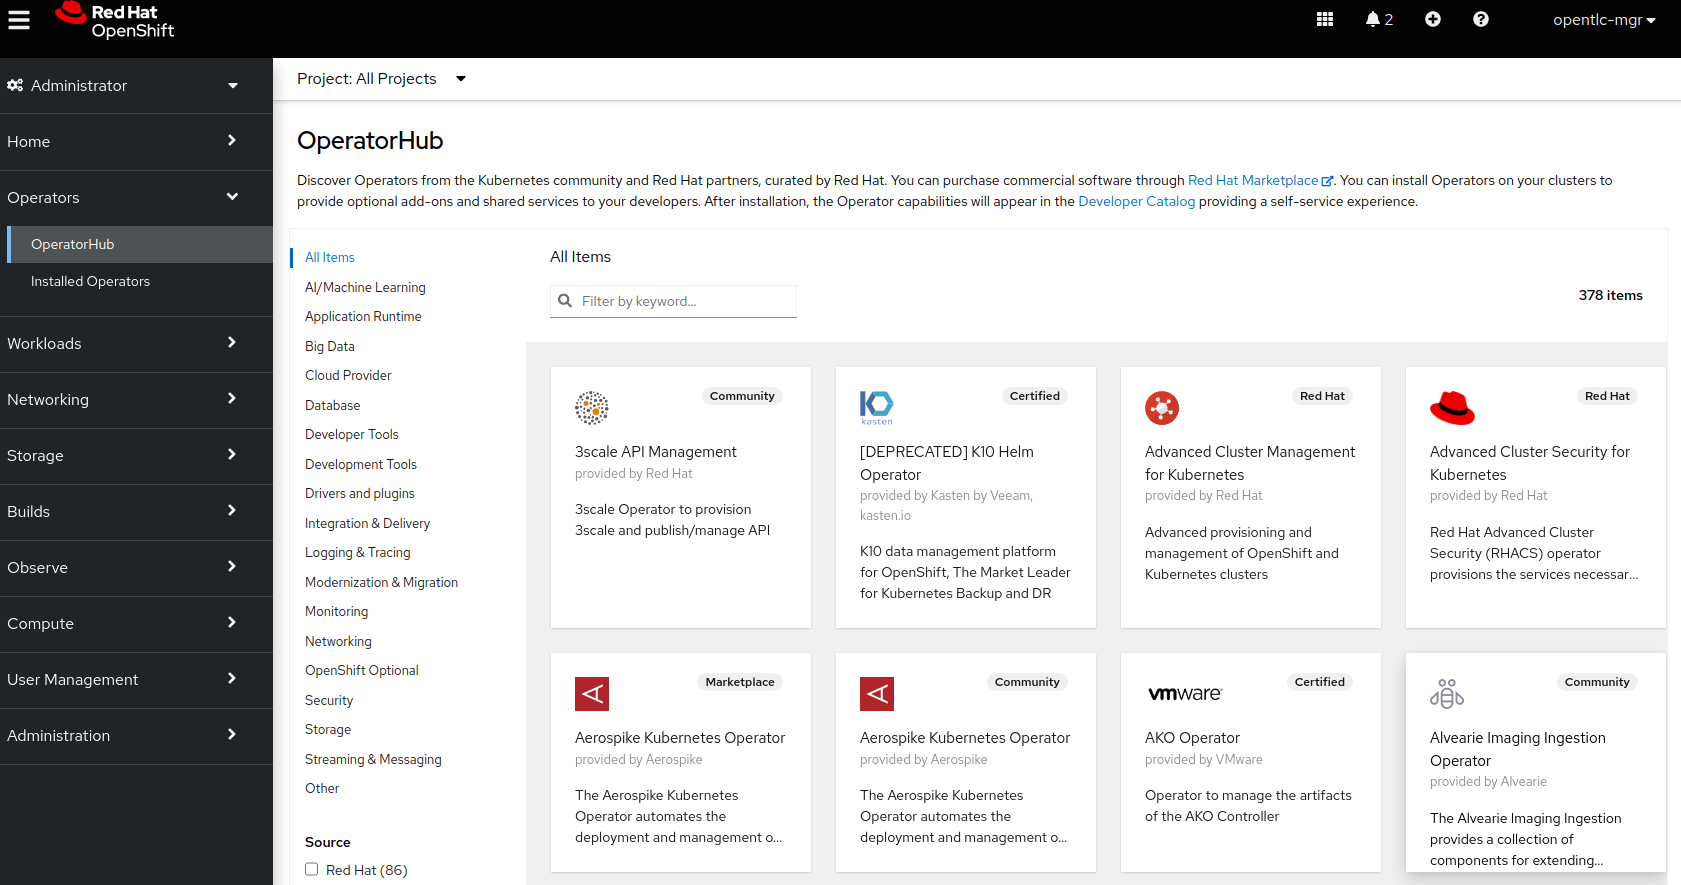
Now type local storage in the Filter by keyword… box.
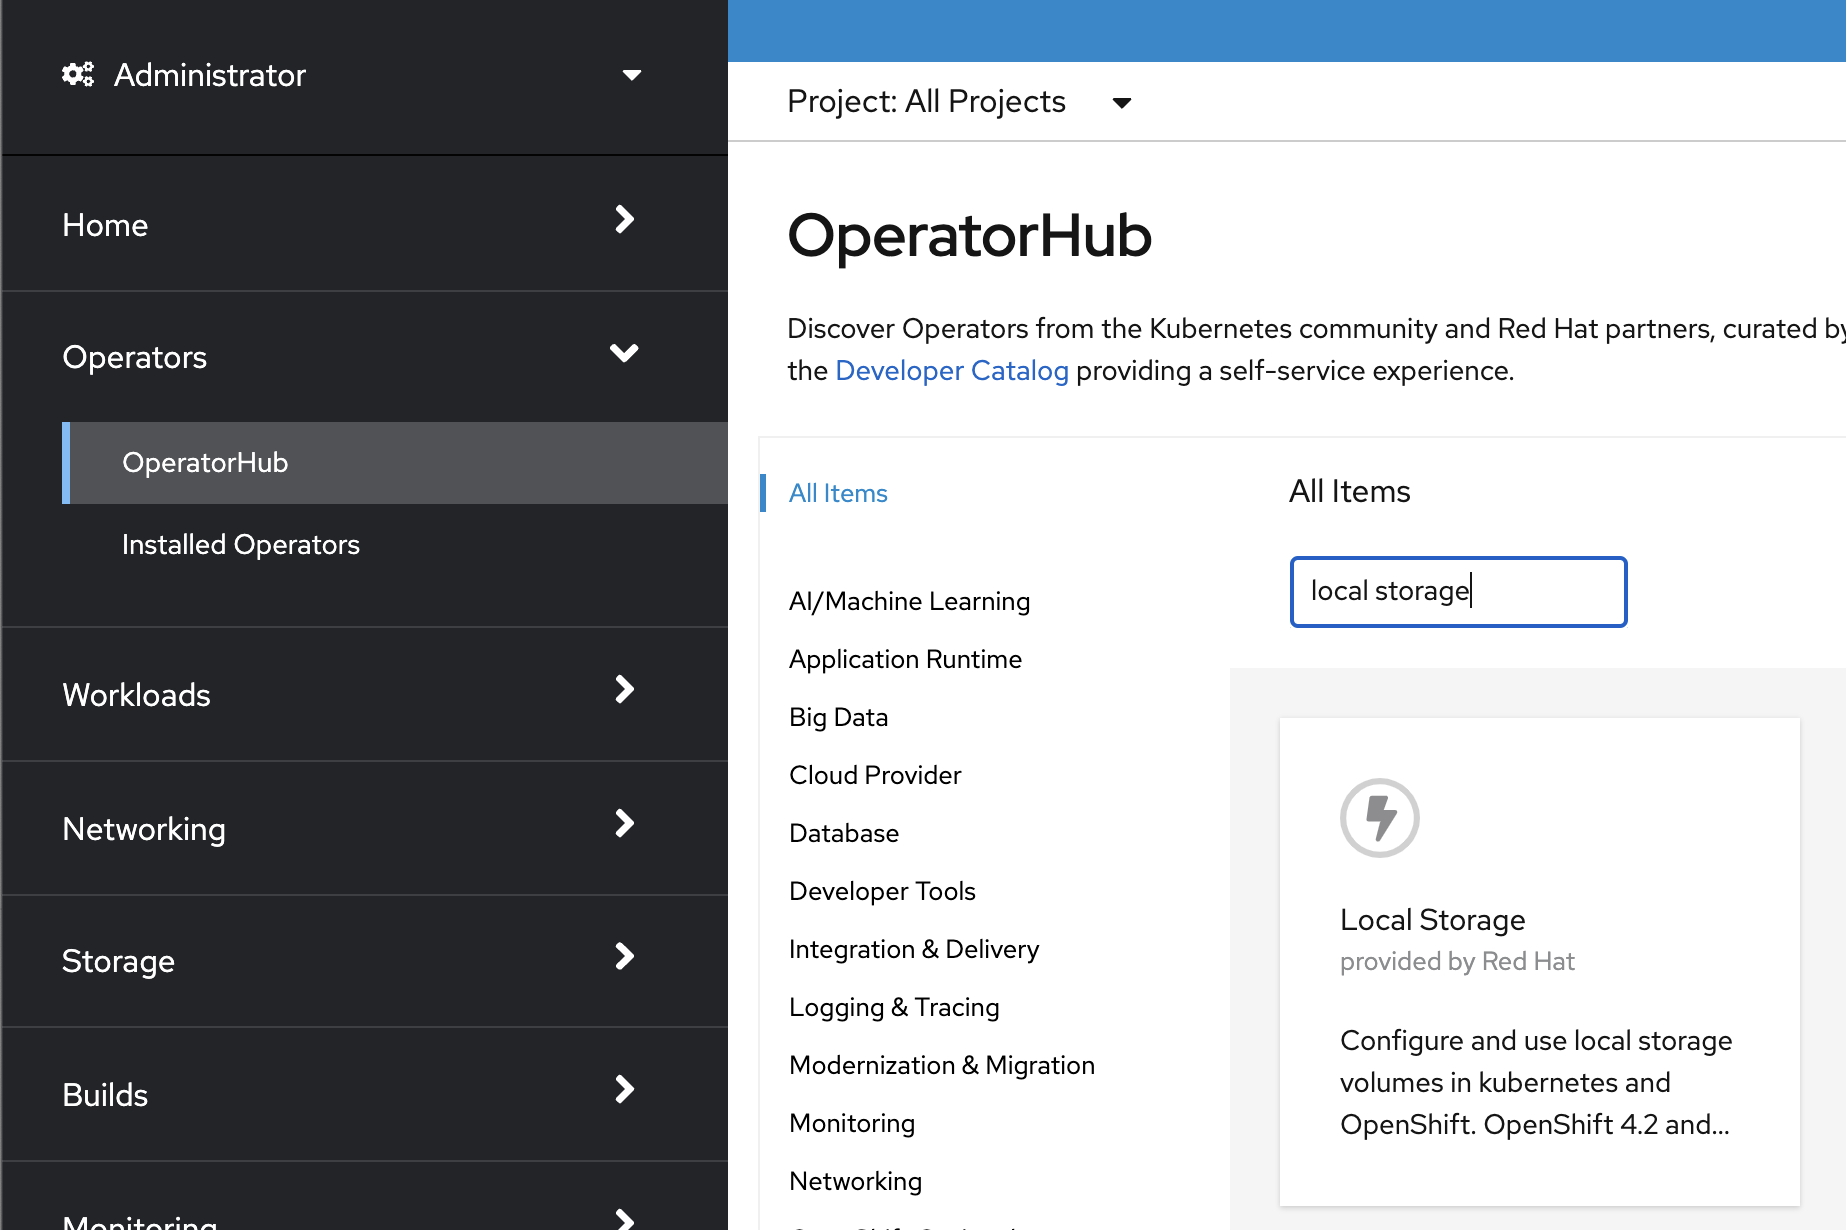
Select OpenShift Data Foundation Operator and then select Install.
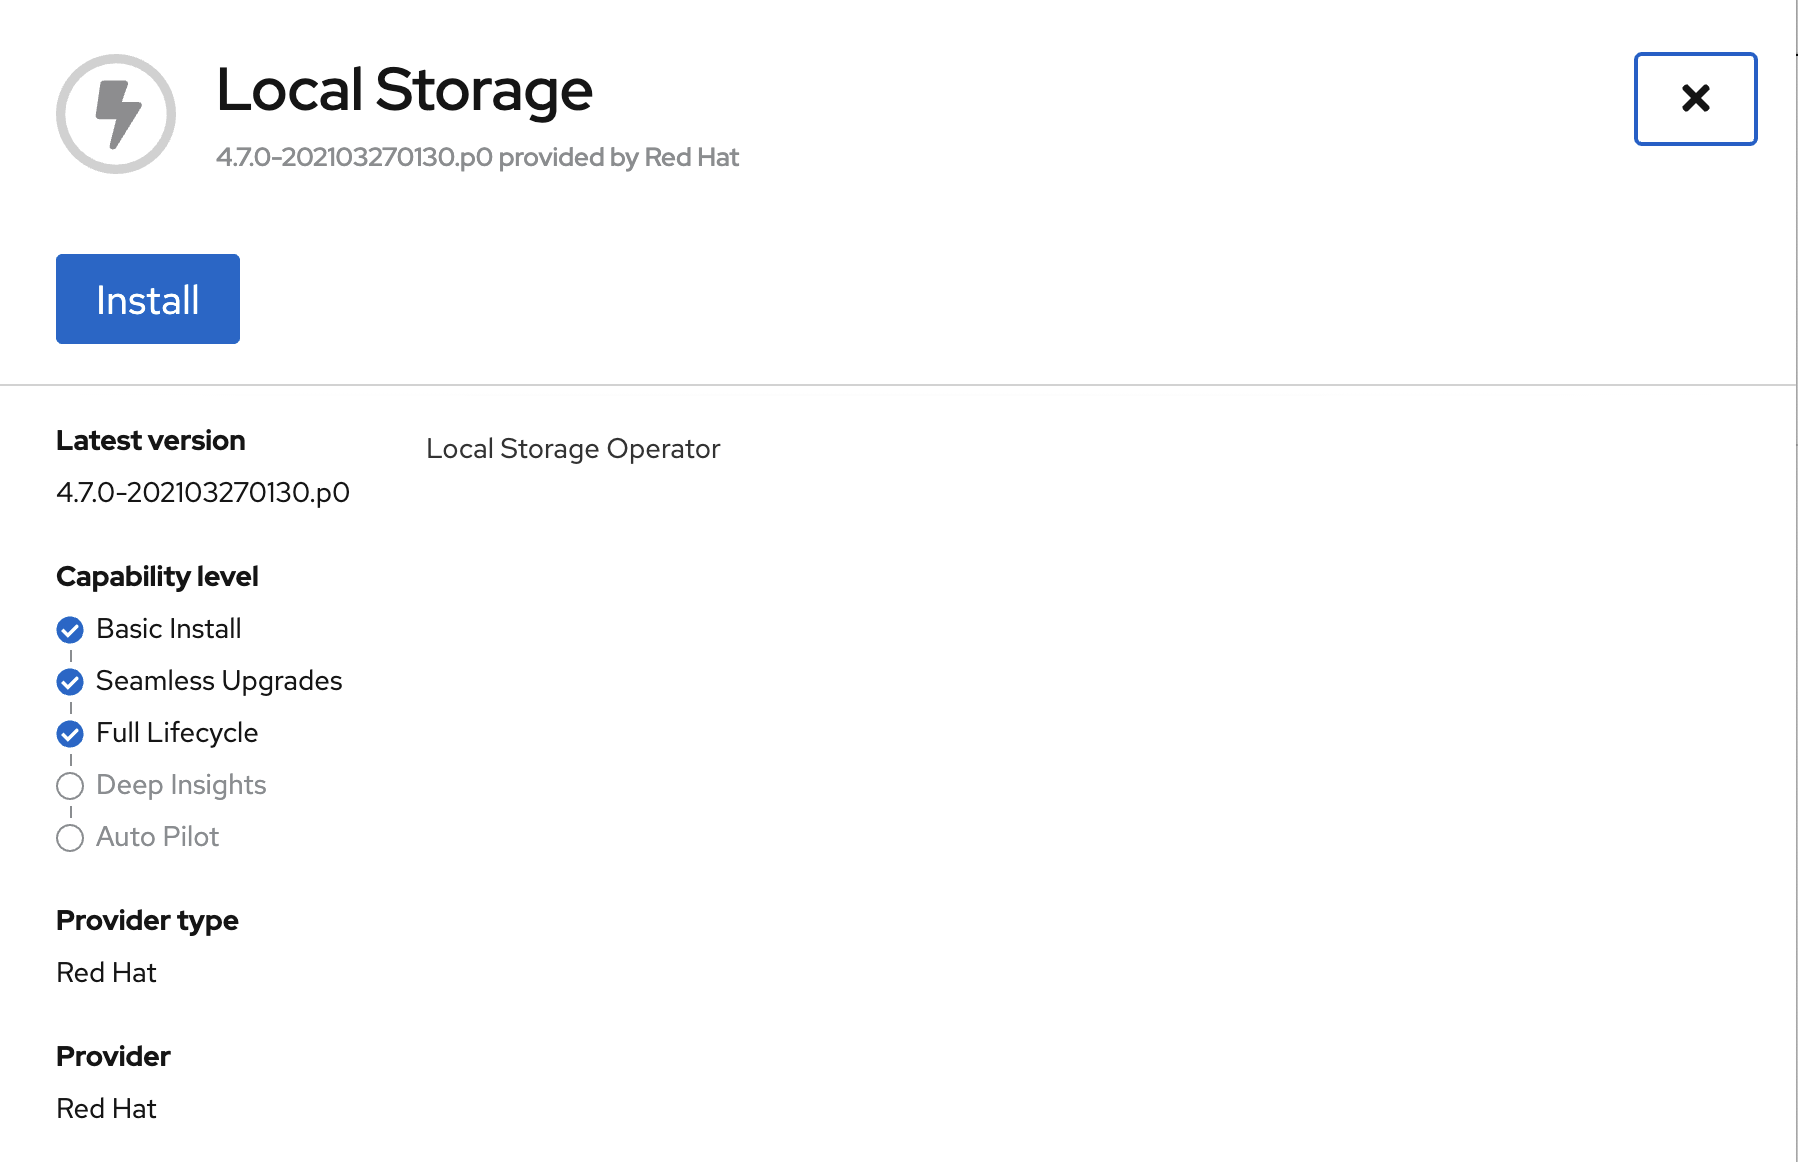
On the next screen make sure the settings are as shown in this figure.
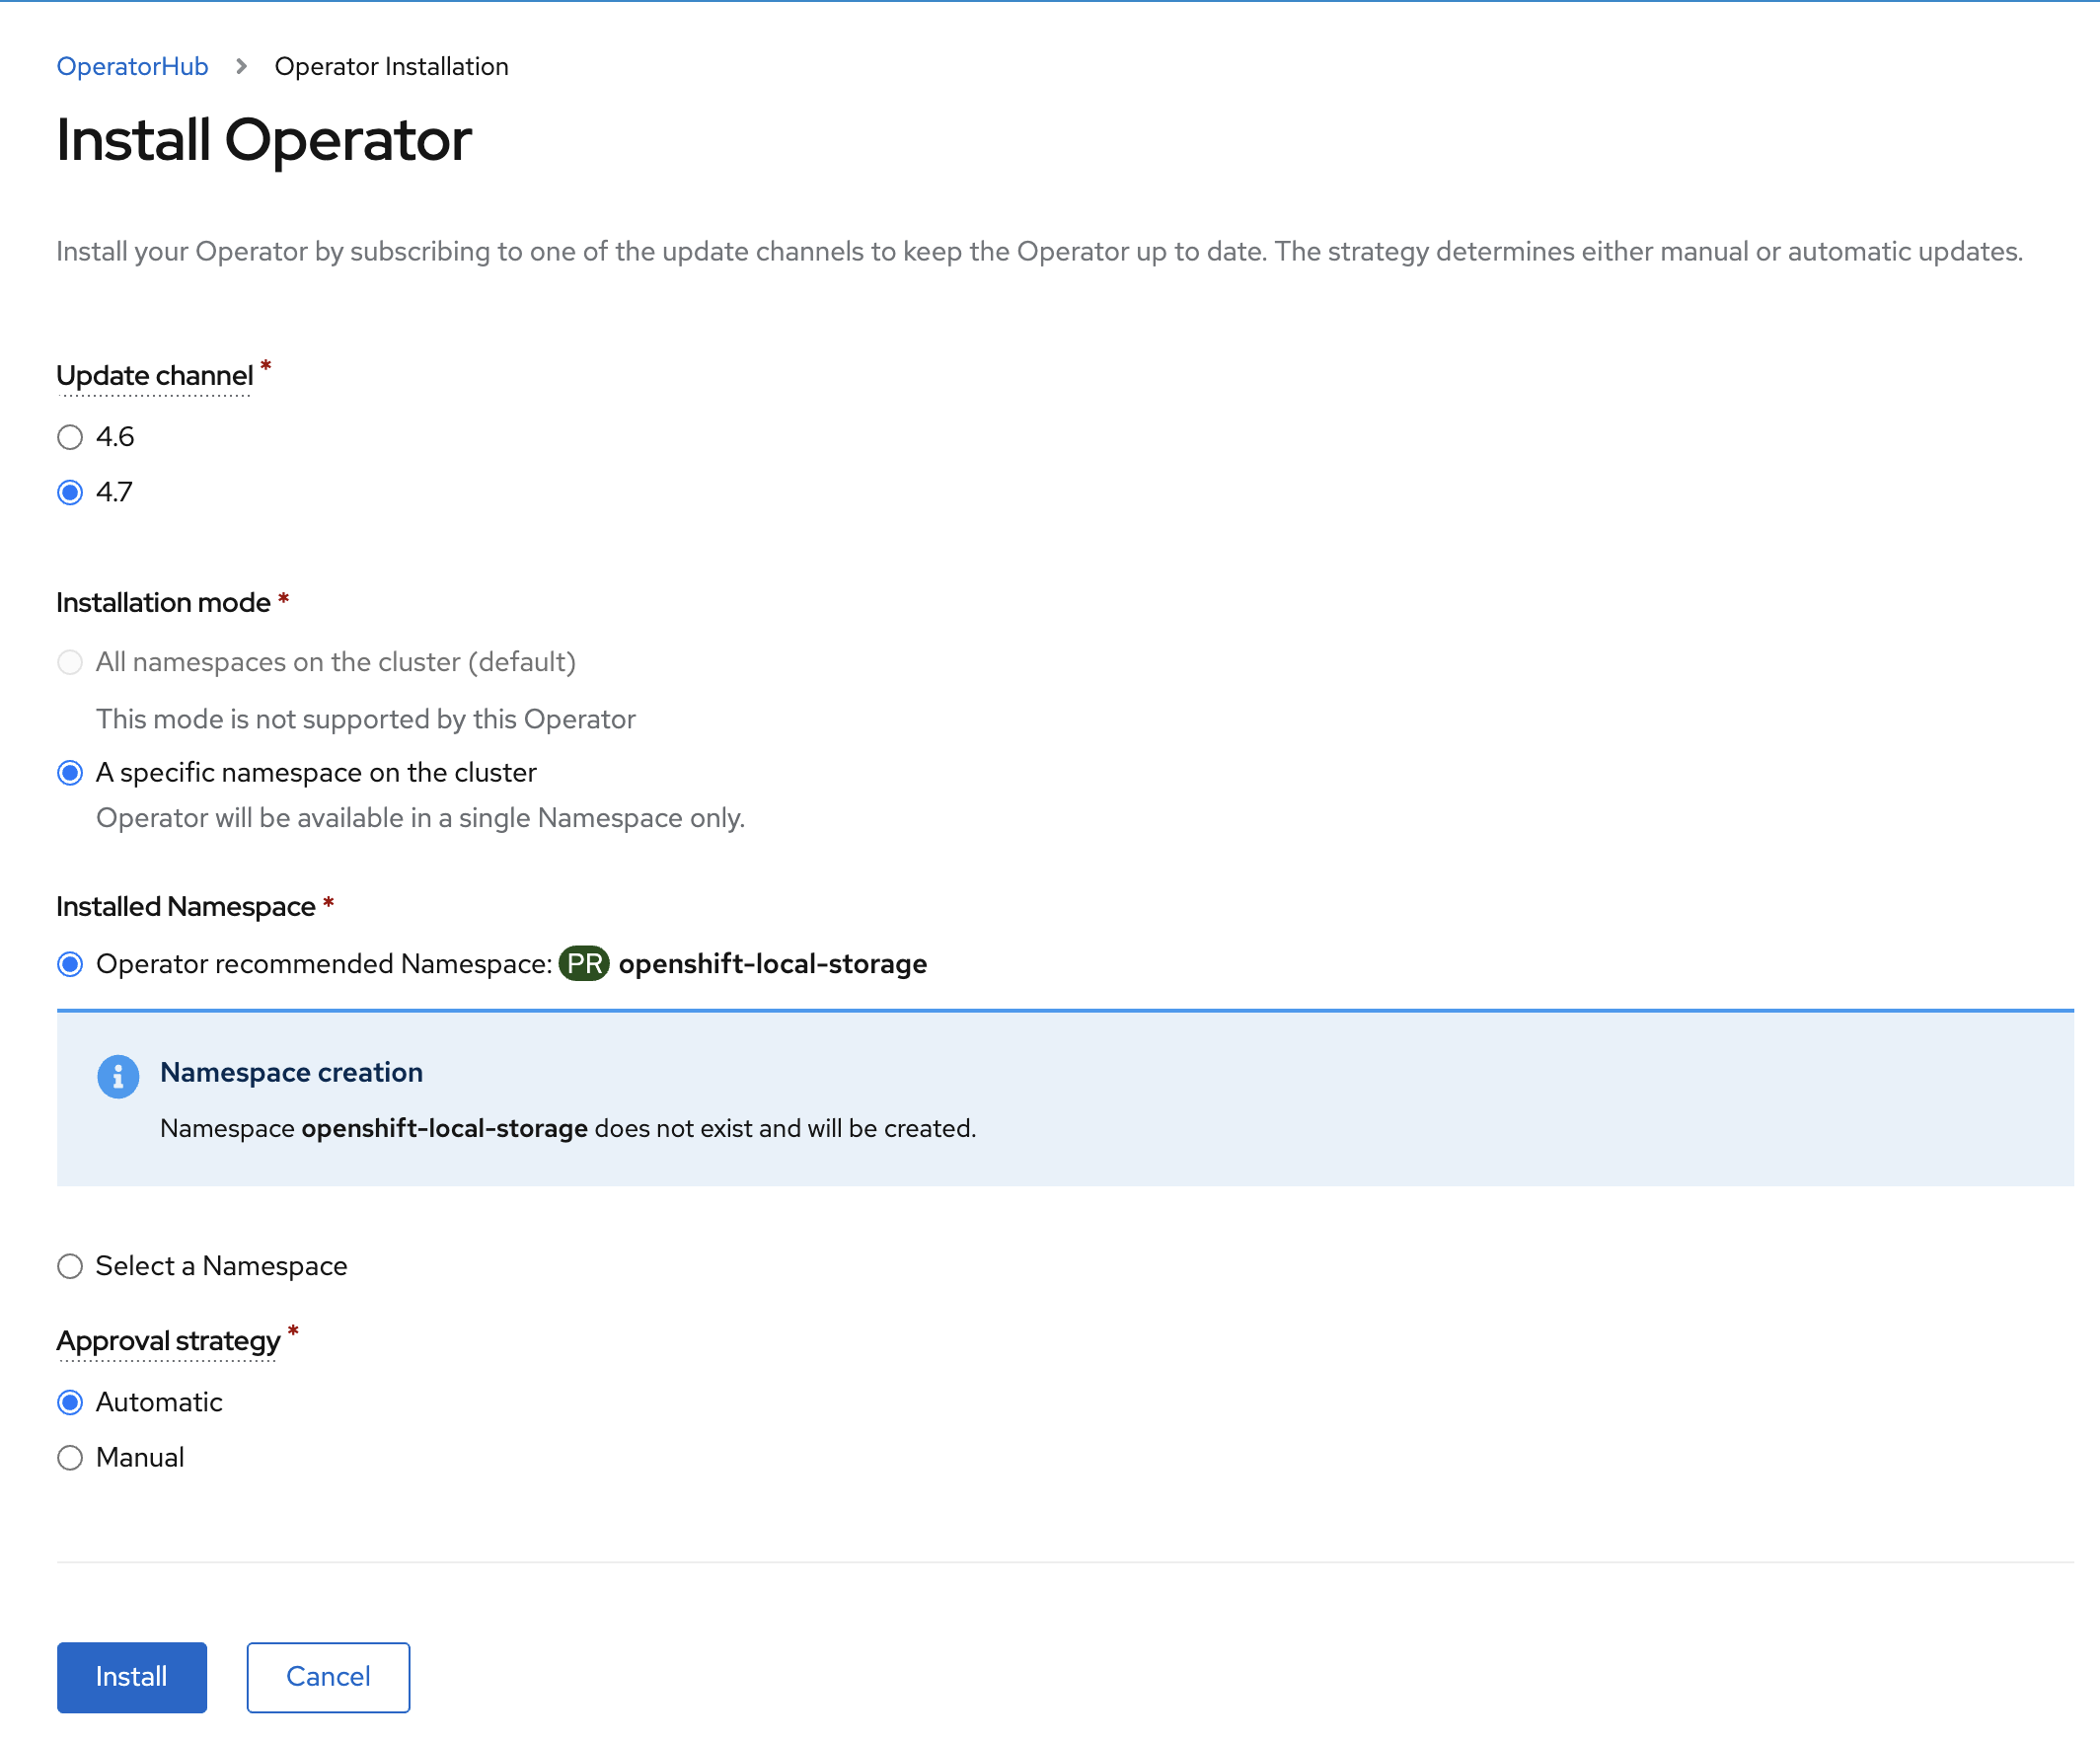
Click Install.
Verify the Local Storage Operator deployment is successful.
oc get csv,pod -n openshift-local-storageNAME DISPLAY VERSION REPLACES PHASE
clusterserviceversion.operators.coreos.com/local-storage-operator.4.7.0-202103270130.p0 Local Storage 4.7.0-202103270130.p0 Succeeded
NAME READY STATUS RESTARTS AGE
pod/local-storage-operator-5879cf9565-r5s7k 1/1 Running 0 31s| Do not proceed with the next instructions until the Local Storage Operator is deployed successfully. |
5. OpenShift Data Foundation Deployment
In this section you will be using four (4) worker OCP 4 nodes to deploy ODF 4 using the ODF Operator in OperatorHub. The following will be installed:
-
The ODF Operator
-
Configure the Local Storage Operator
-
All other ODF resources (Ceph Pods, NooBaa Pods, StorageClasses)
5.1. ODF Operator Deployment
Navigate to the Operators → OperatorHub menu.
Now type openshift container storage in the Filter by keyword… box.
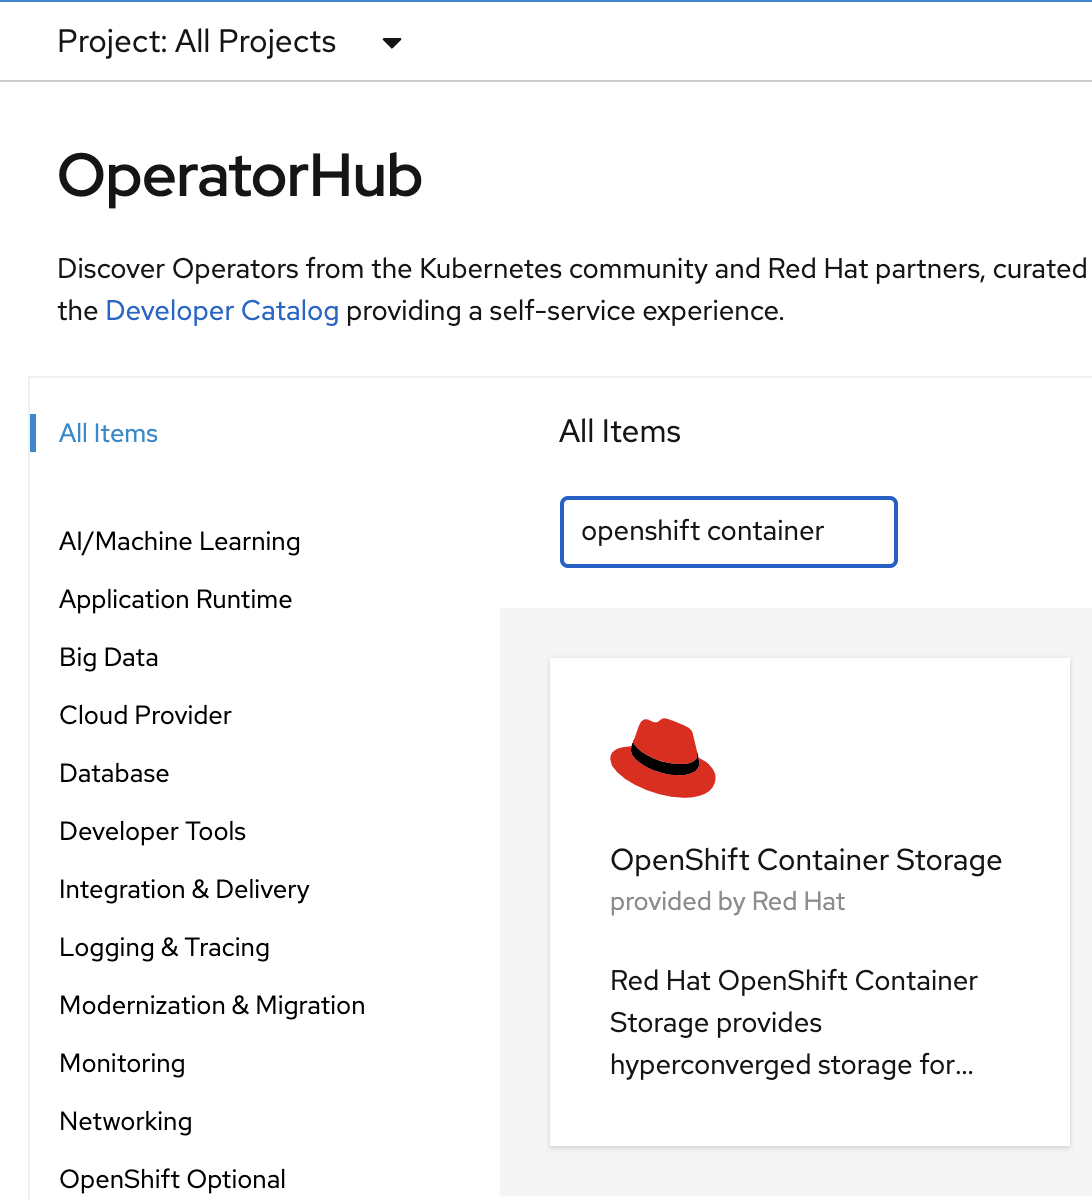
Select OpenShift Data Foundation Operator and then select Install.
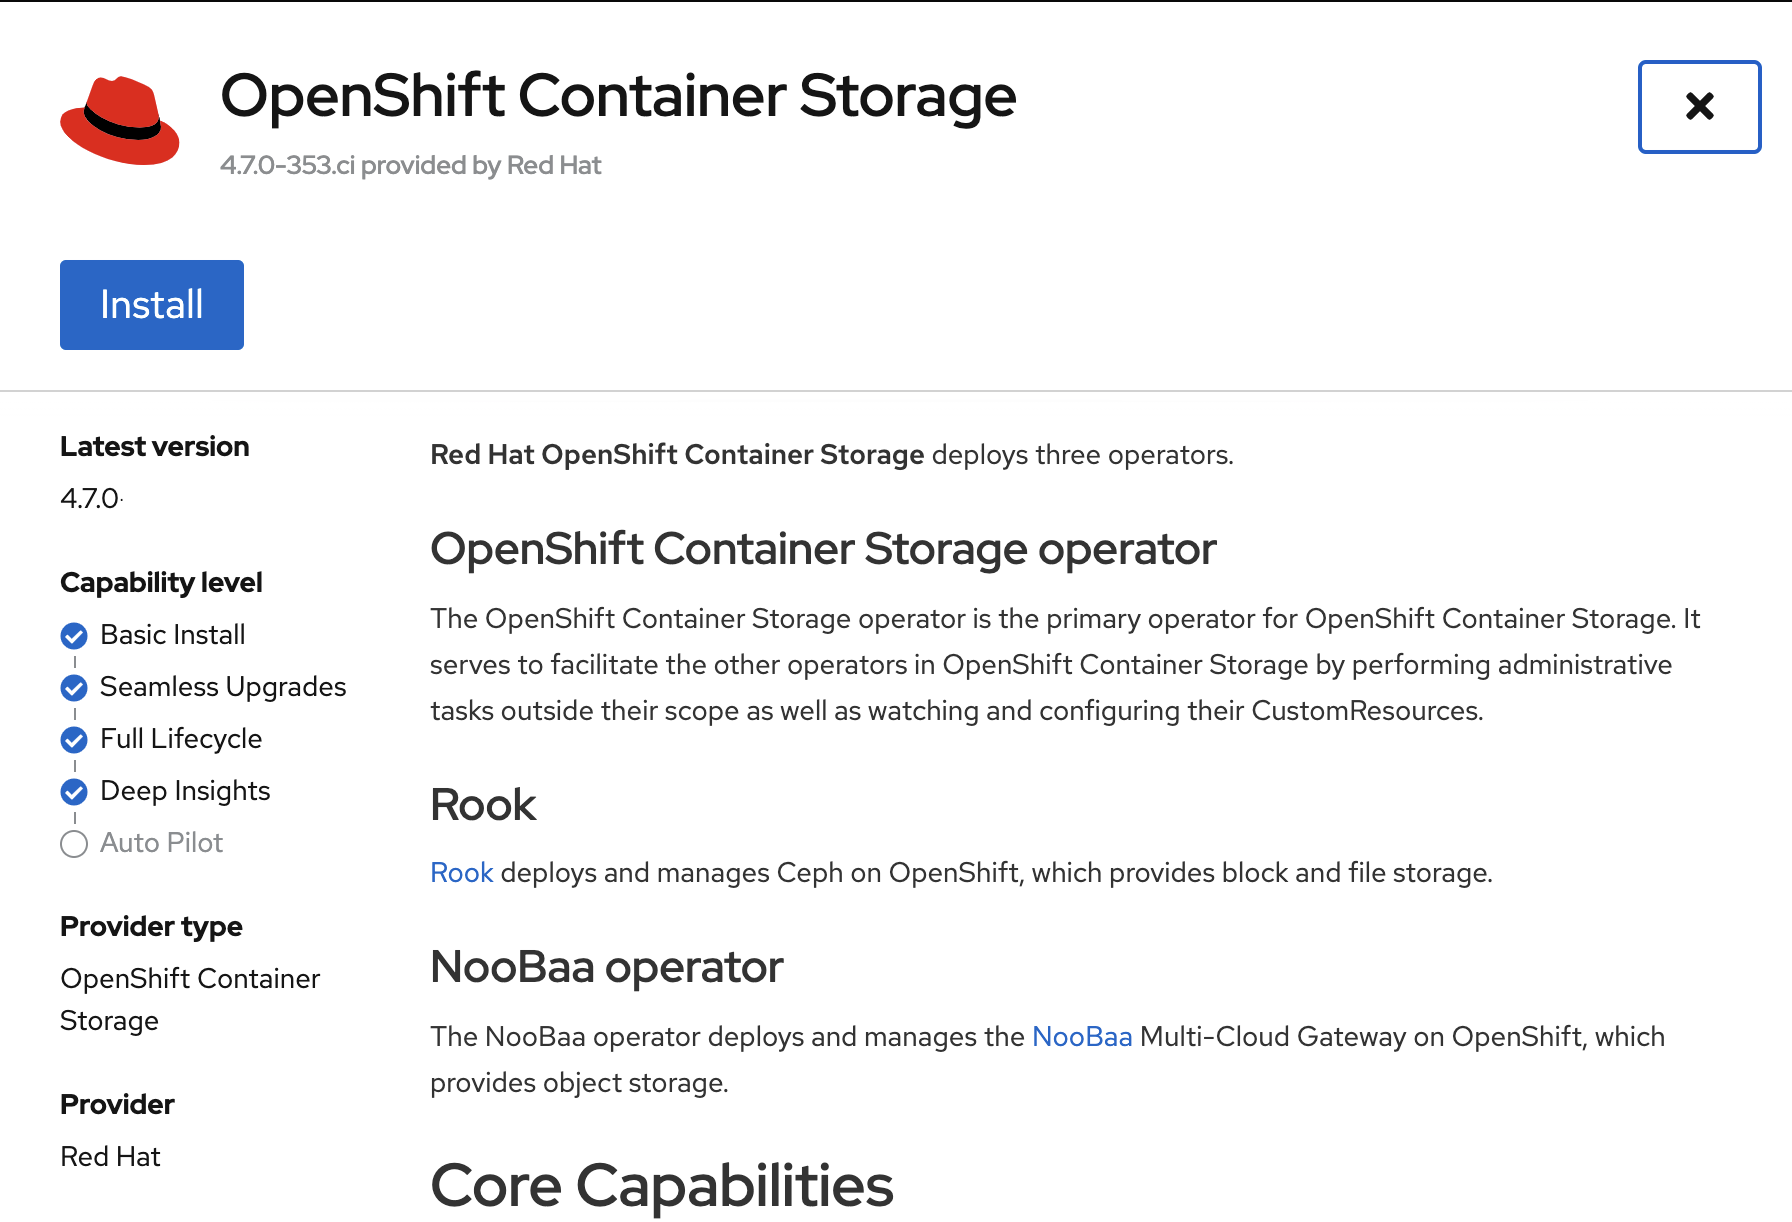
On the next screen make sure the settings are as shown in this figure.
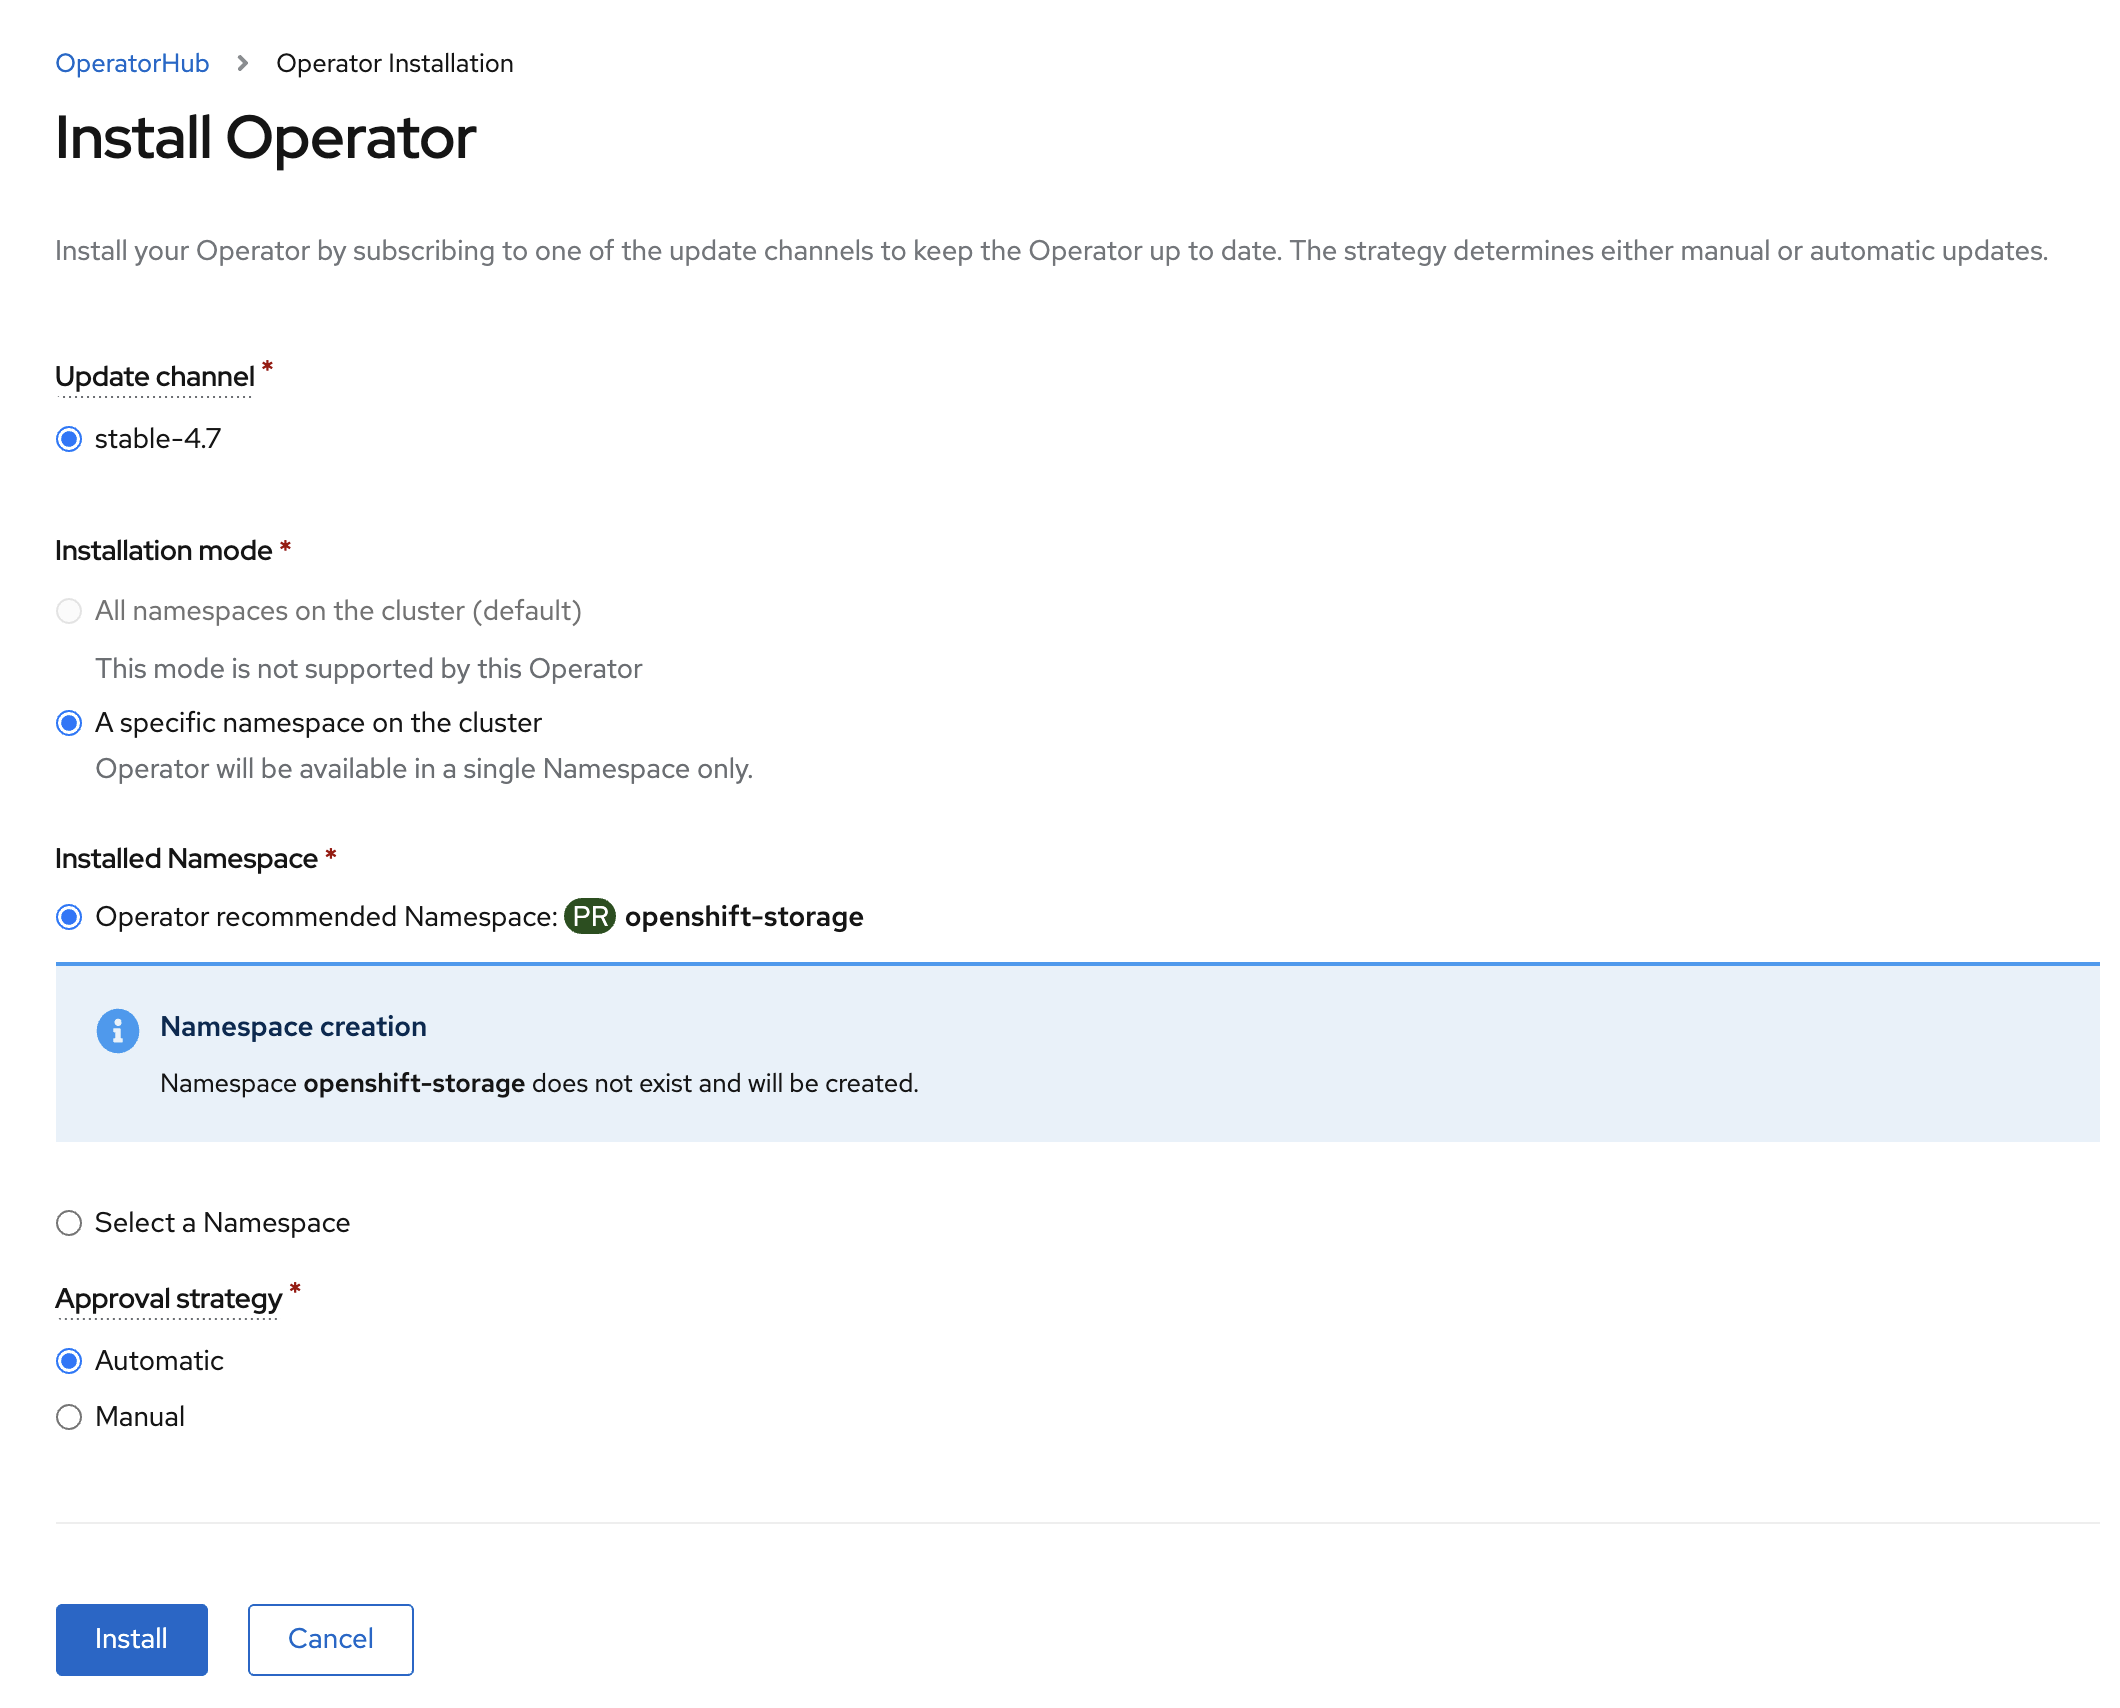
Click Install.
Now you can go back to your terminal window to check the progress of the installation.
If you do not know the name of the catalog source you can display all available
ones using the oc get catalogsource -A command.
|
Verify the operator is deployed successfully.
oc get pods,csv -n openshift-storageNAME READY STATUS RESTARTS AGE
pod/noobaa-operator-746ddfc79-fcrfz 1/1 Running 0 33s
pod/ocs-metrics-exporter-54b6d689f8-ltxvp 1/1 Running 0 32s
pod/ocs-operator-5bcdd97ff4-rgn7f 1/1 Running 0 33s
pod/rook-ceph-operator-7dd585bd97-sldkk 1/1 Running 0 33s
NAME DISPLAY VERSION REPLACES PHASE
clusterserviceversion.operators.coreos.com/ocs-operator.v4.7.0-339.ci OpenShift Container Storage 4.7.0-339.ci Succeeded| This will mark that the installation of your operator was successful. Reaching this state can take several minutes. |
5.2. ODF Cluster Deployment
Navigate to the Operators → Installed Operators menu.
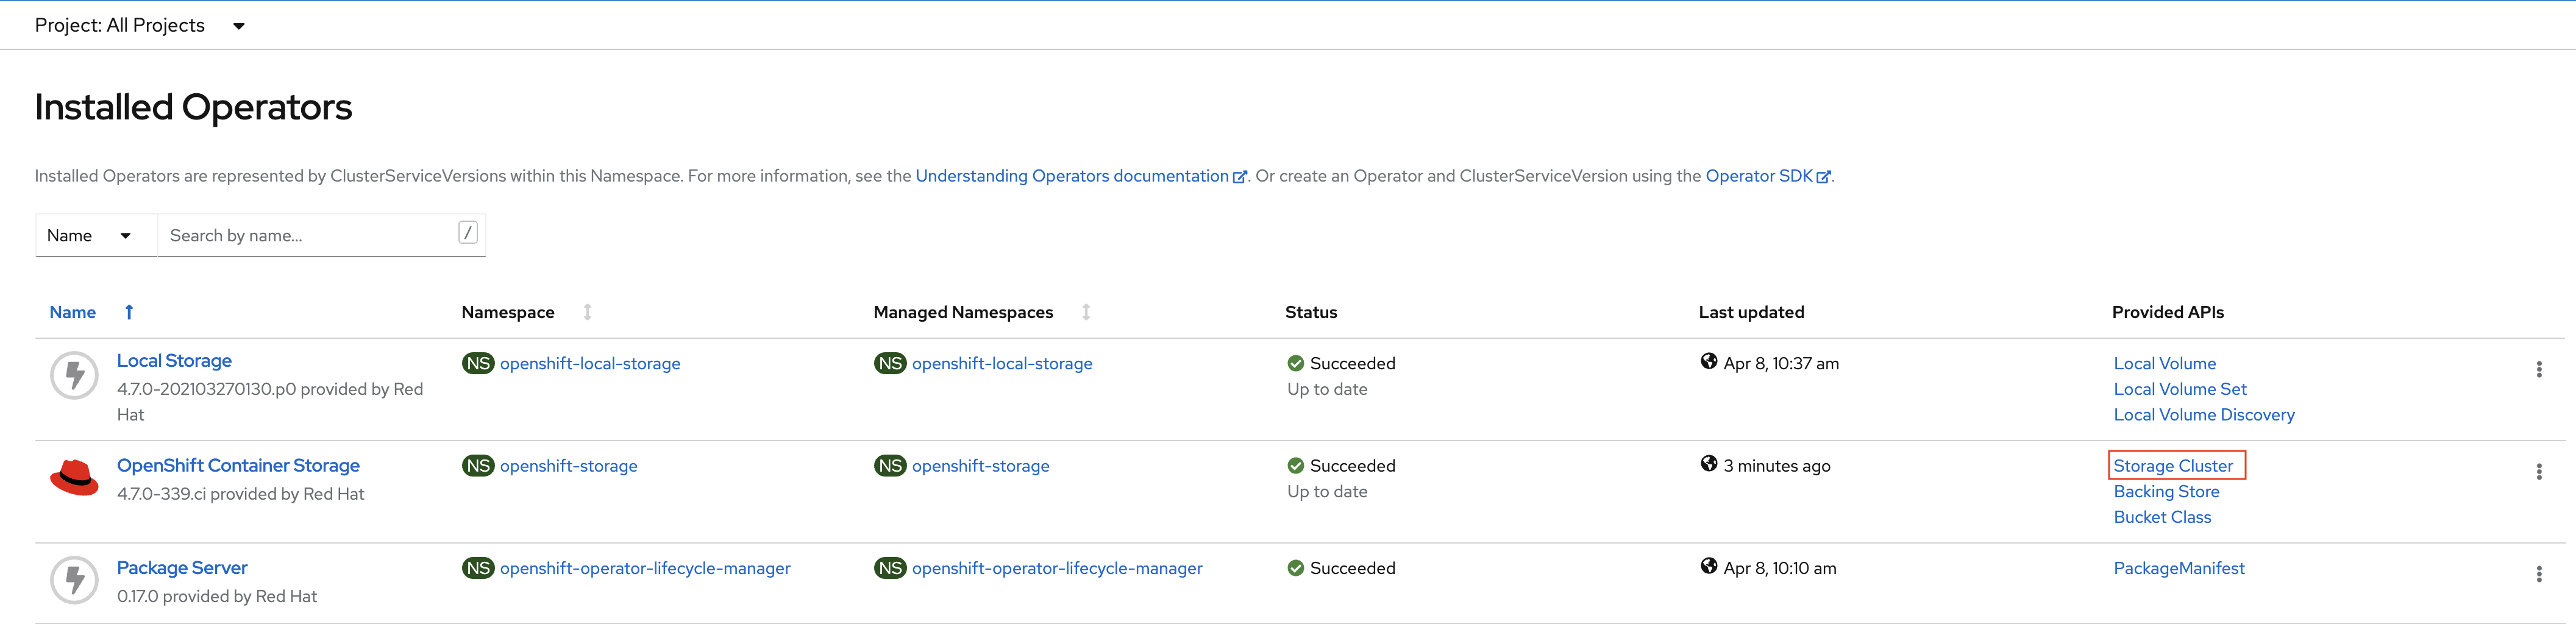
Click on Storage Cluster on the right hand side of the UI as indicated
in the screen capture above.
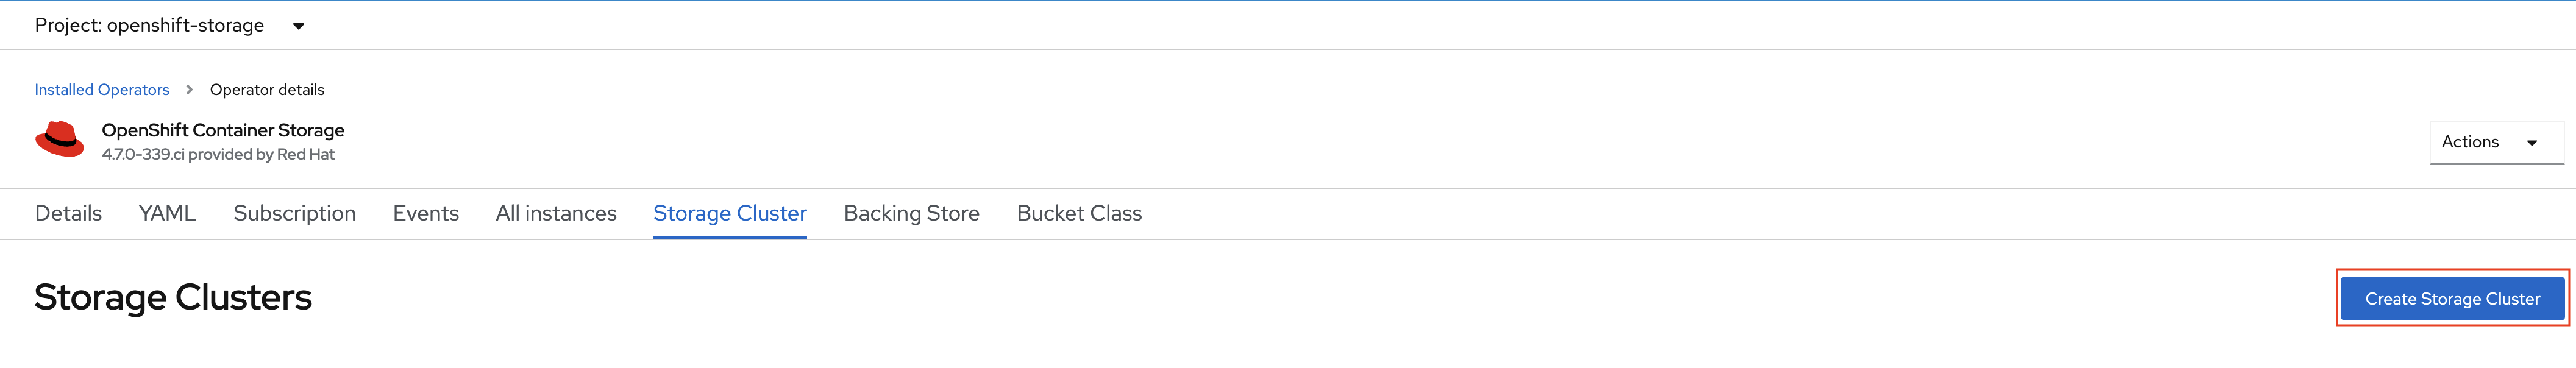
Click on Create Storage Cluster on the right hand side of the UI.
Select the Internal - Attached Devices deployment option
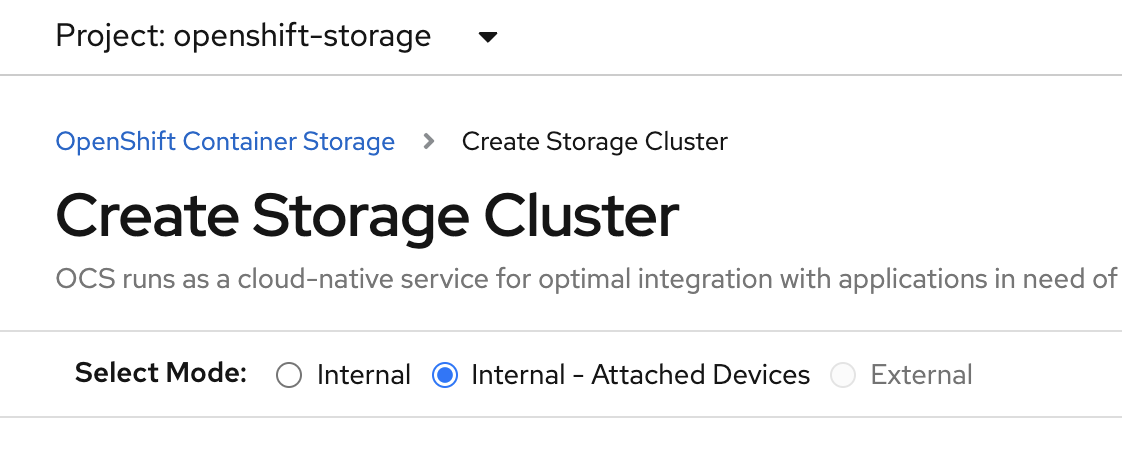
Provide storage cluster details.
Click Next at the bottom of the UI.
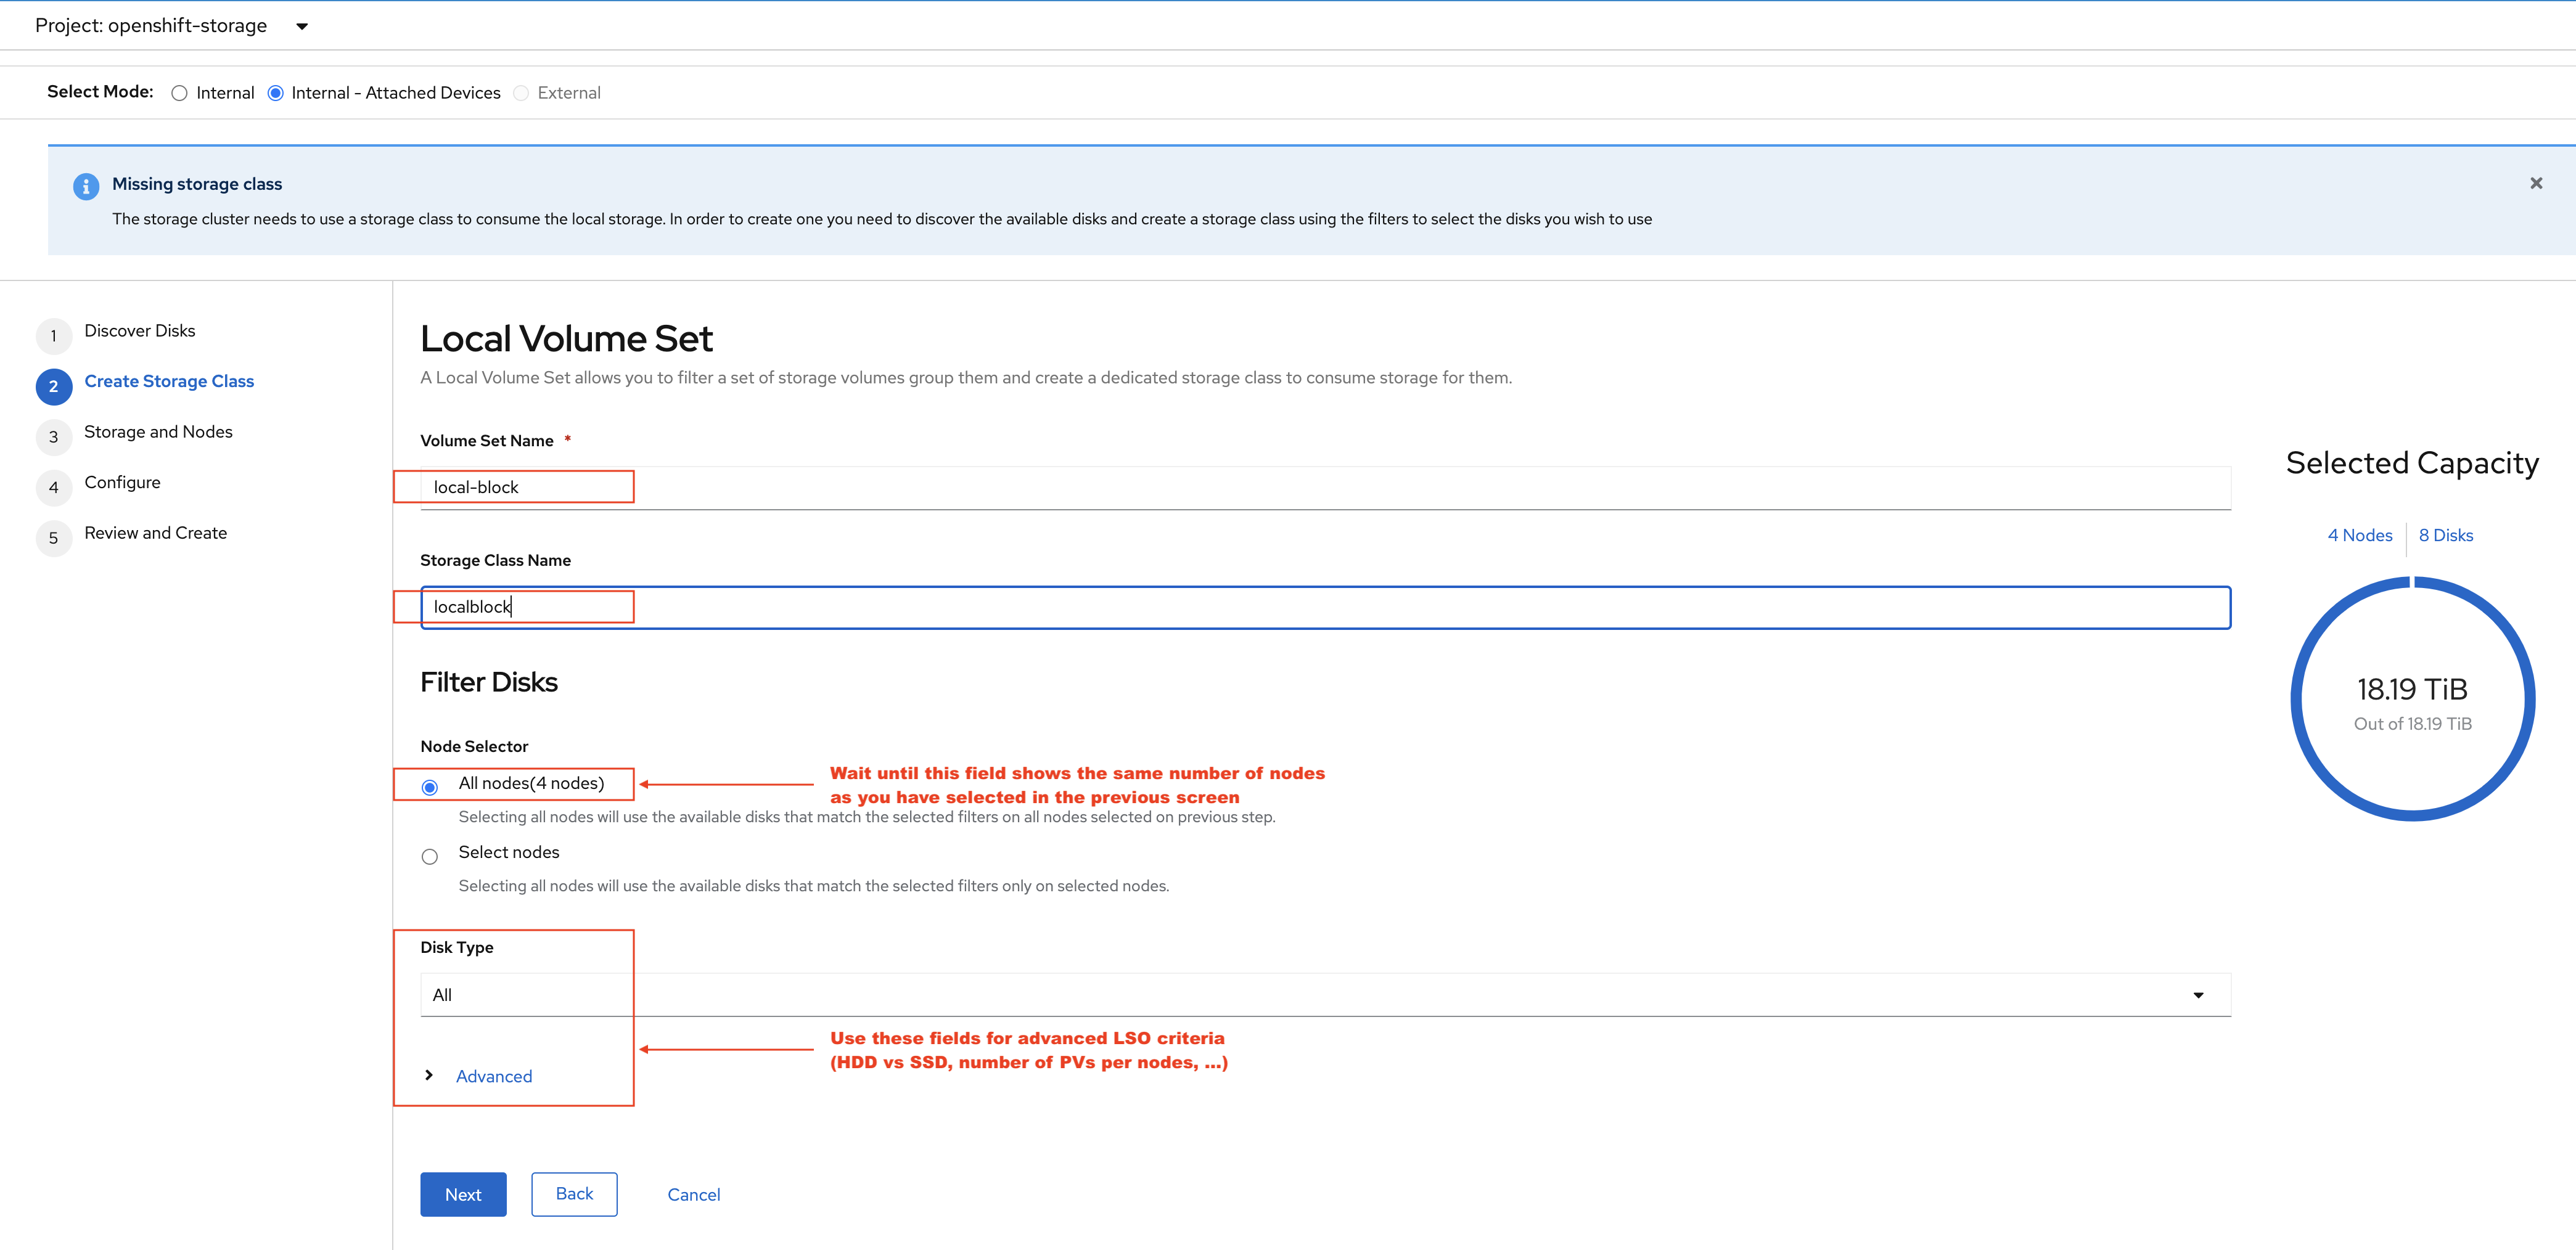
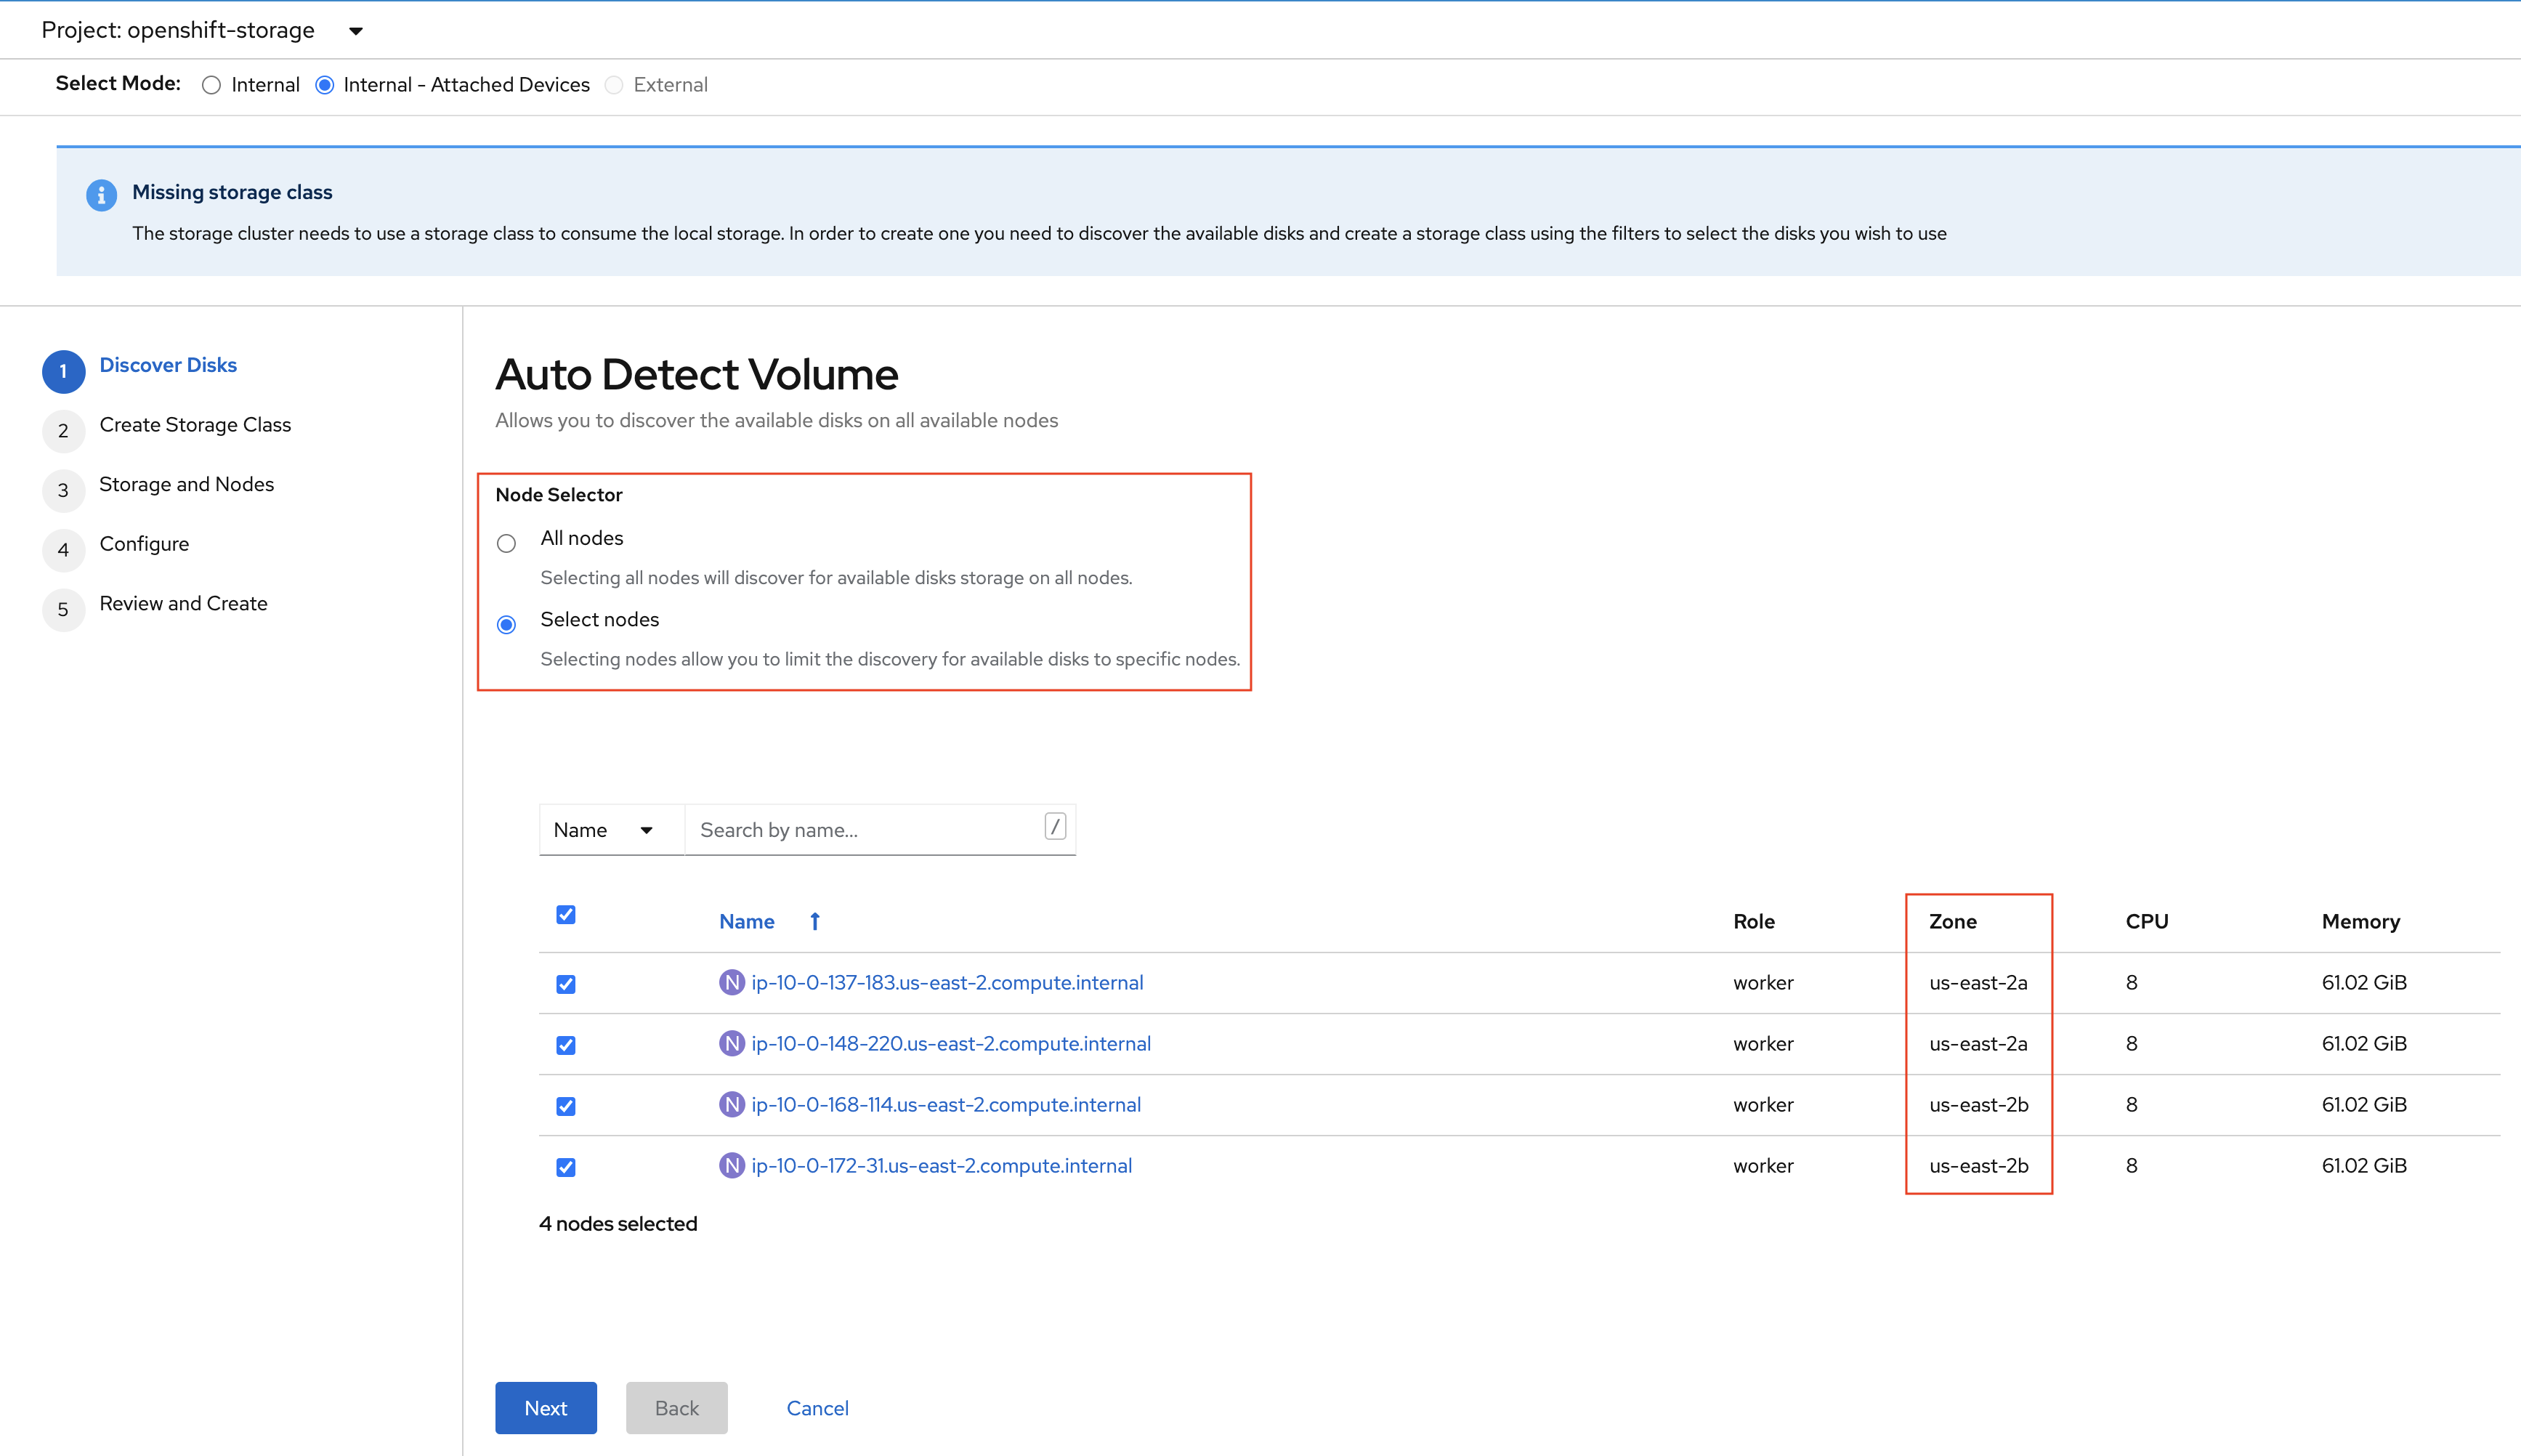
Enter the desired configuration for your Local Storage Operator and clicl Next.
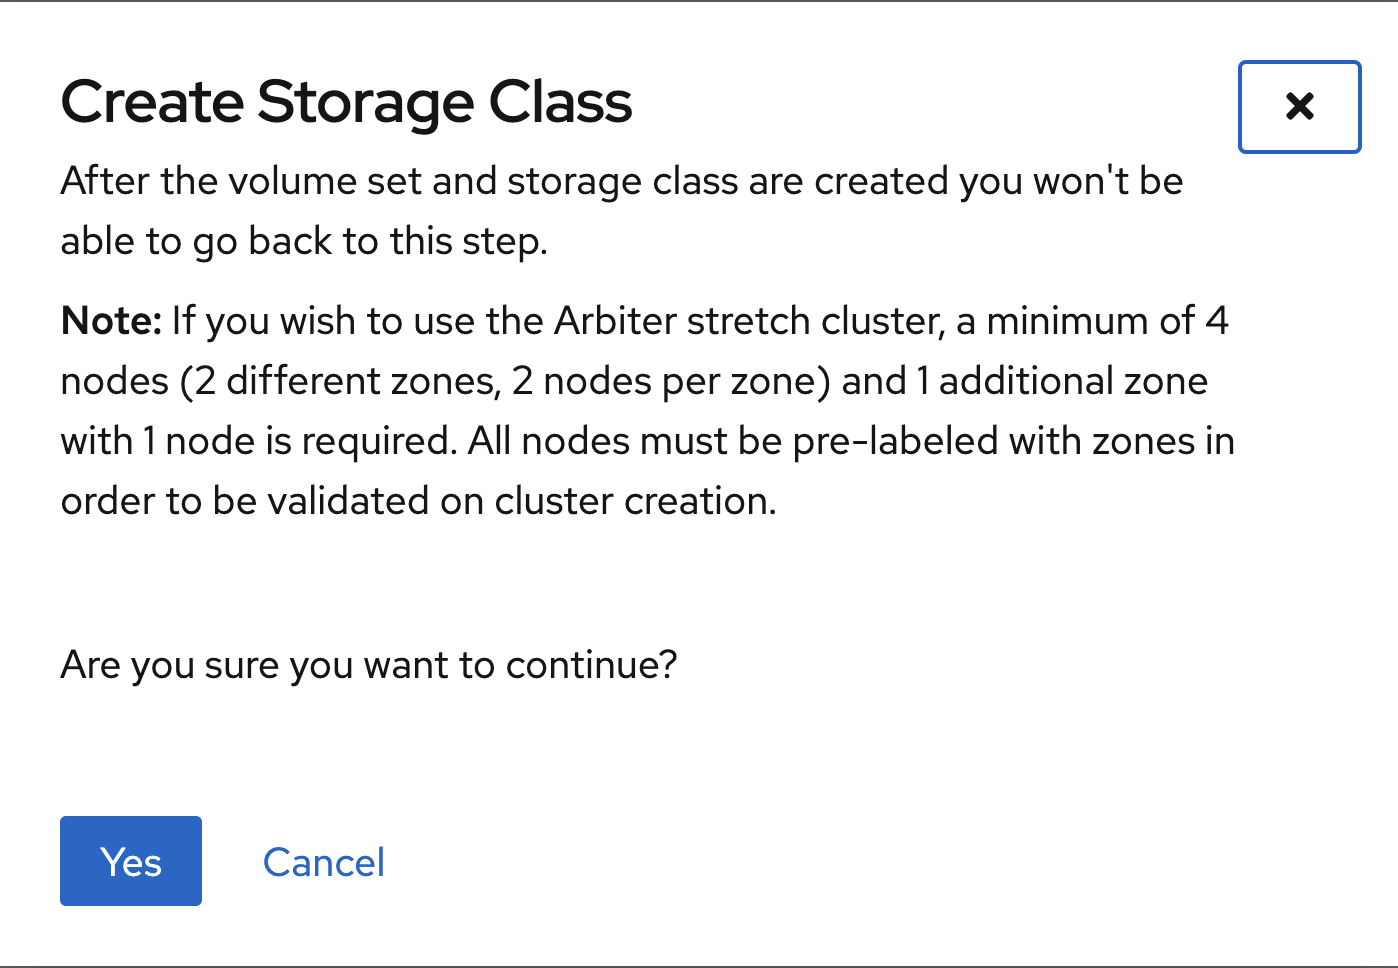
Click Yes when asked to confirm the storage class creation.
| The LSO confirguration will take no less than a minute. Please be patient! |
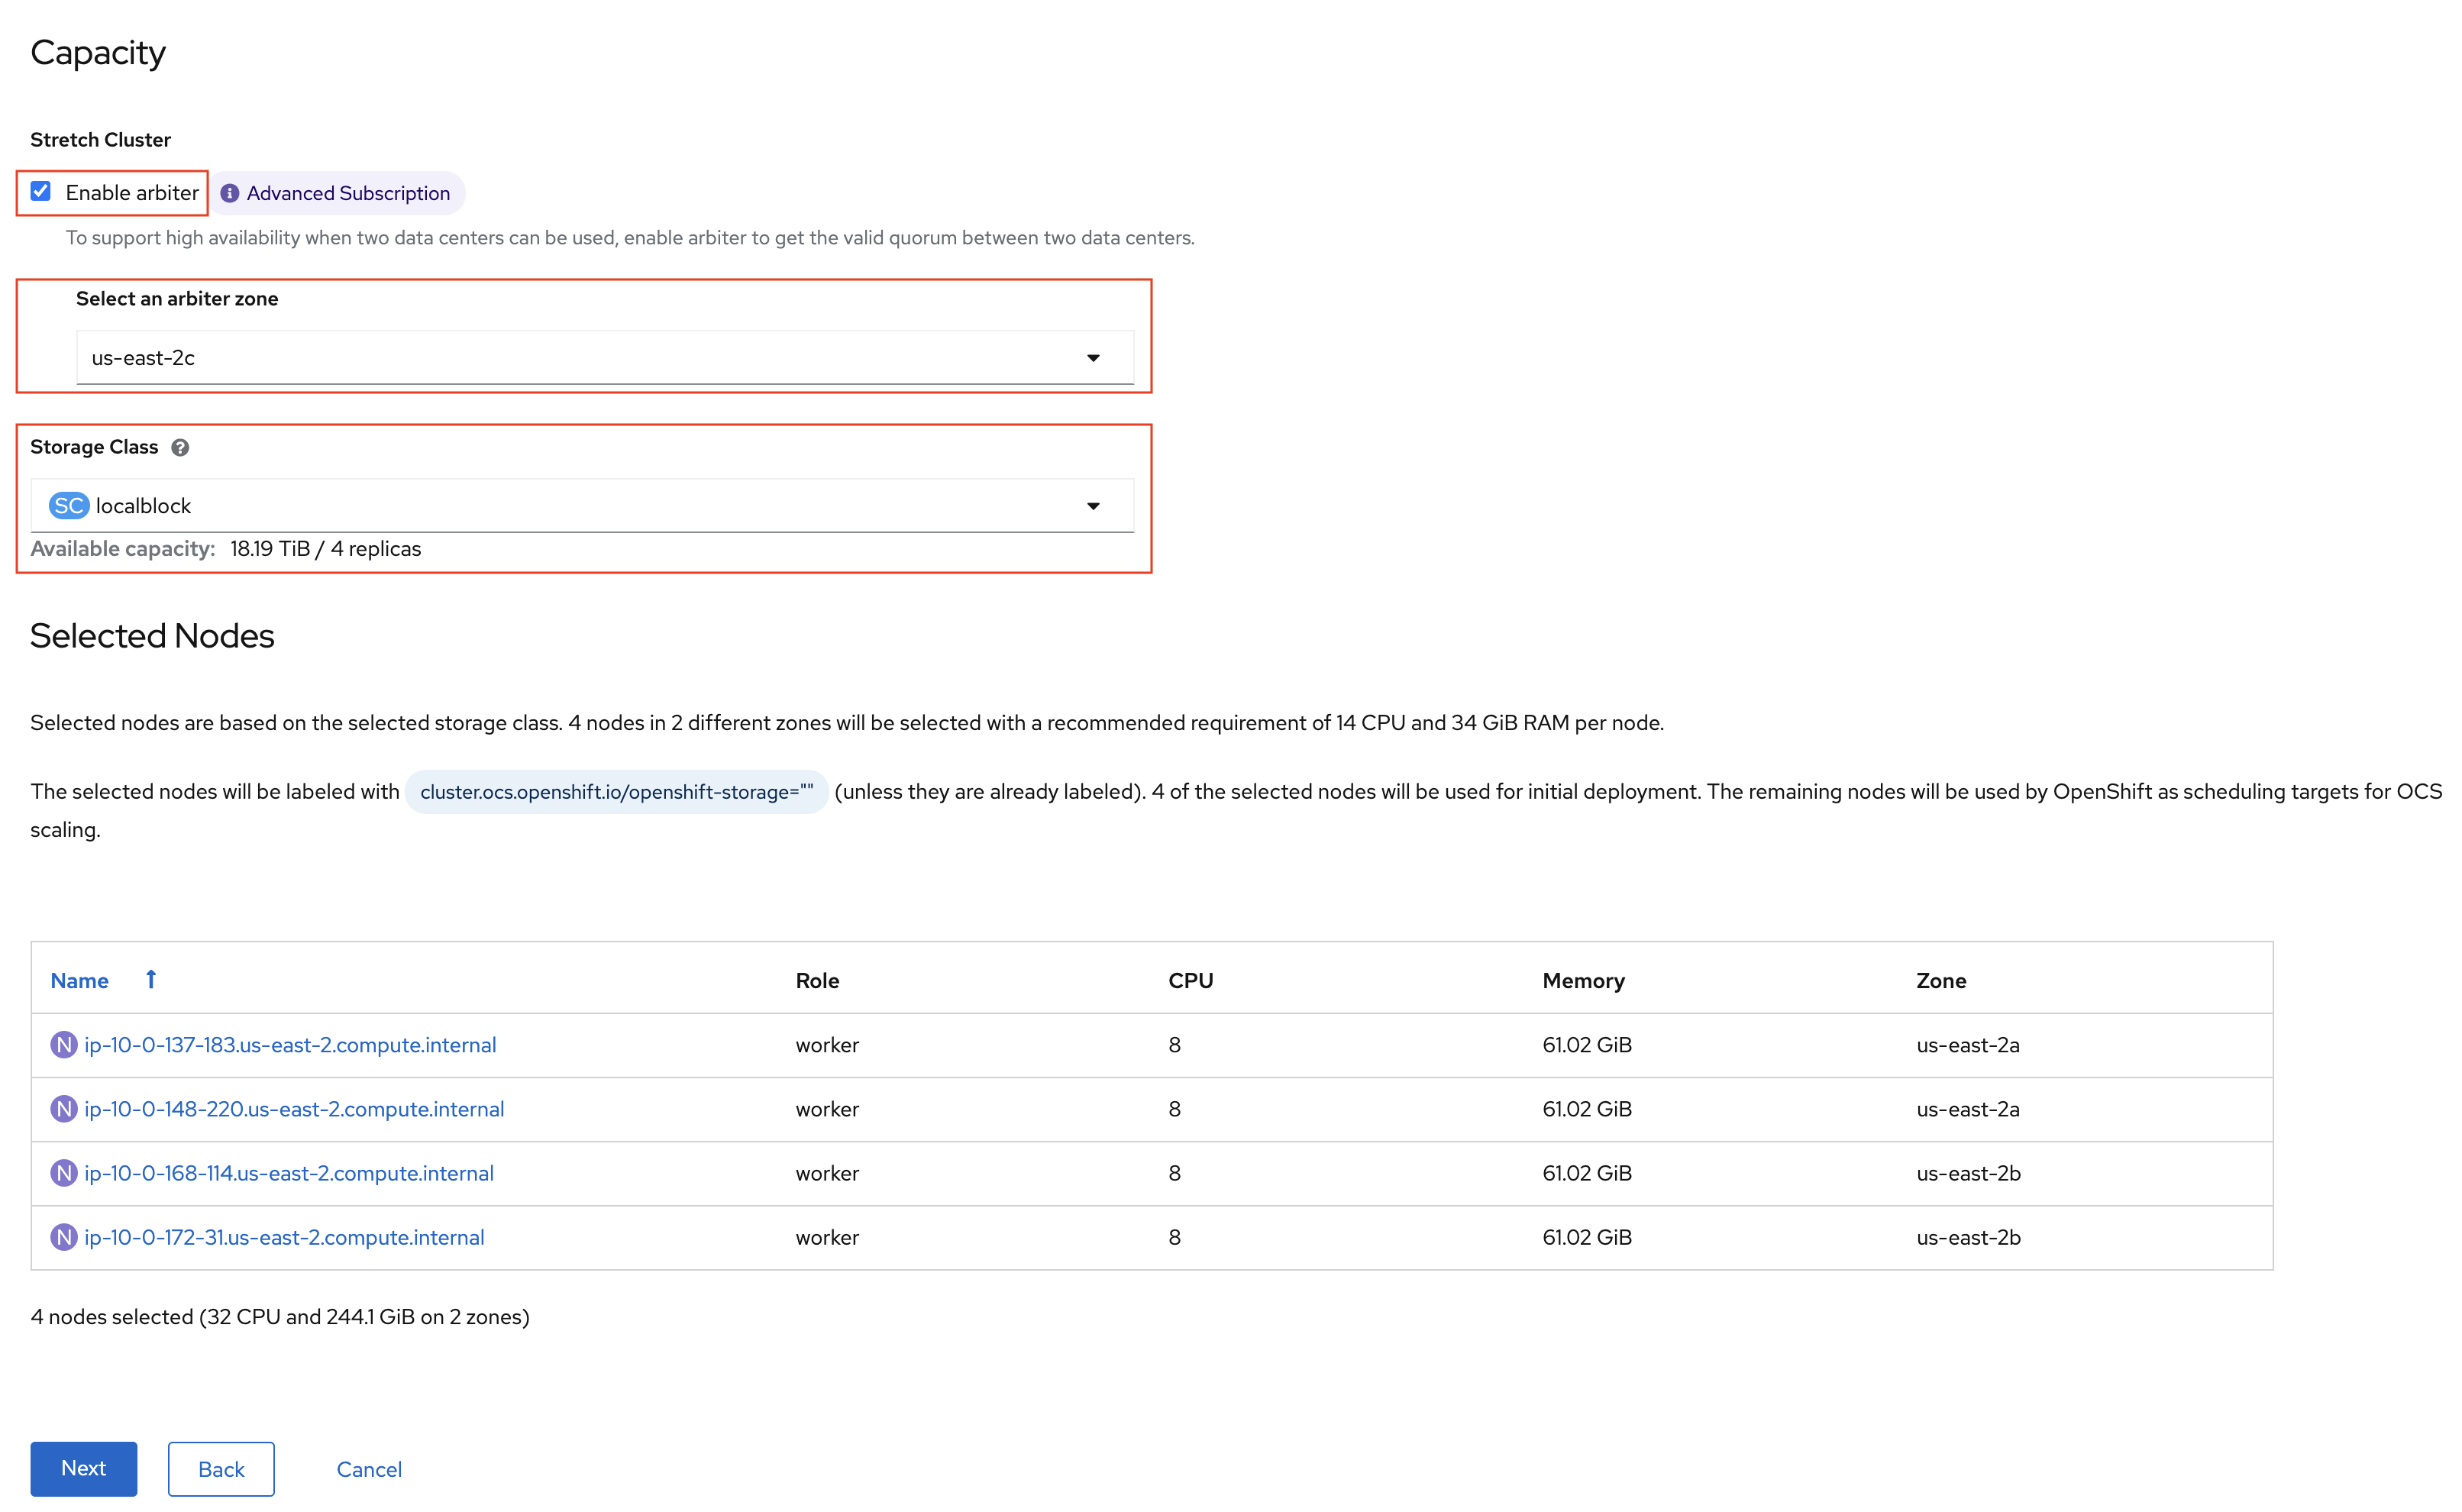
Check the Enable arbiter checkbox, select the correct availability zone
that is to receive the Arbiter Monitor and select the LSO storage class
you created as illustrated in the screen capture. Then click Next.
When asked if you want to enable encryption just click Next again.
| You can combine cluster wide encryption with Arbiter mode during a real deployment. It is not the topic of this particular exercise. |
Review parameters and create the cluster.
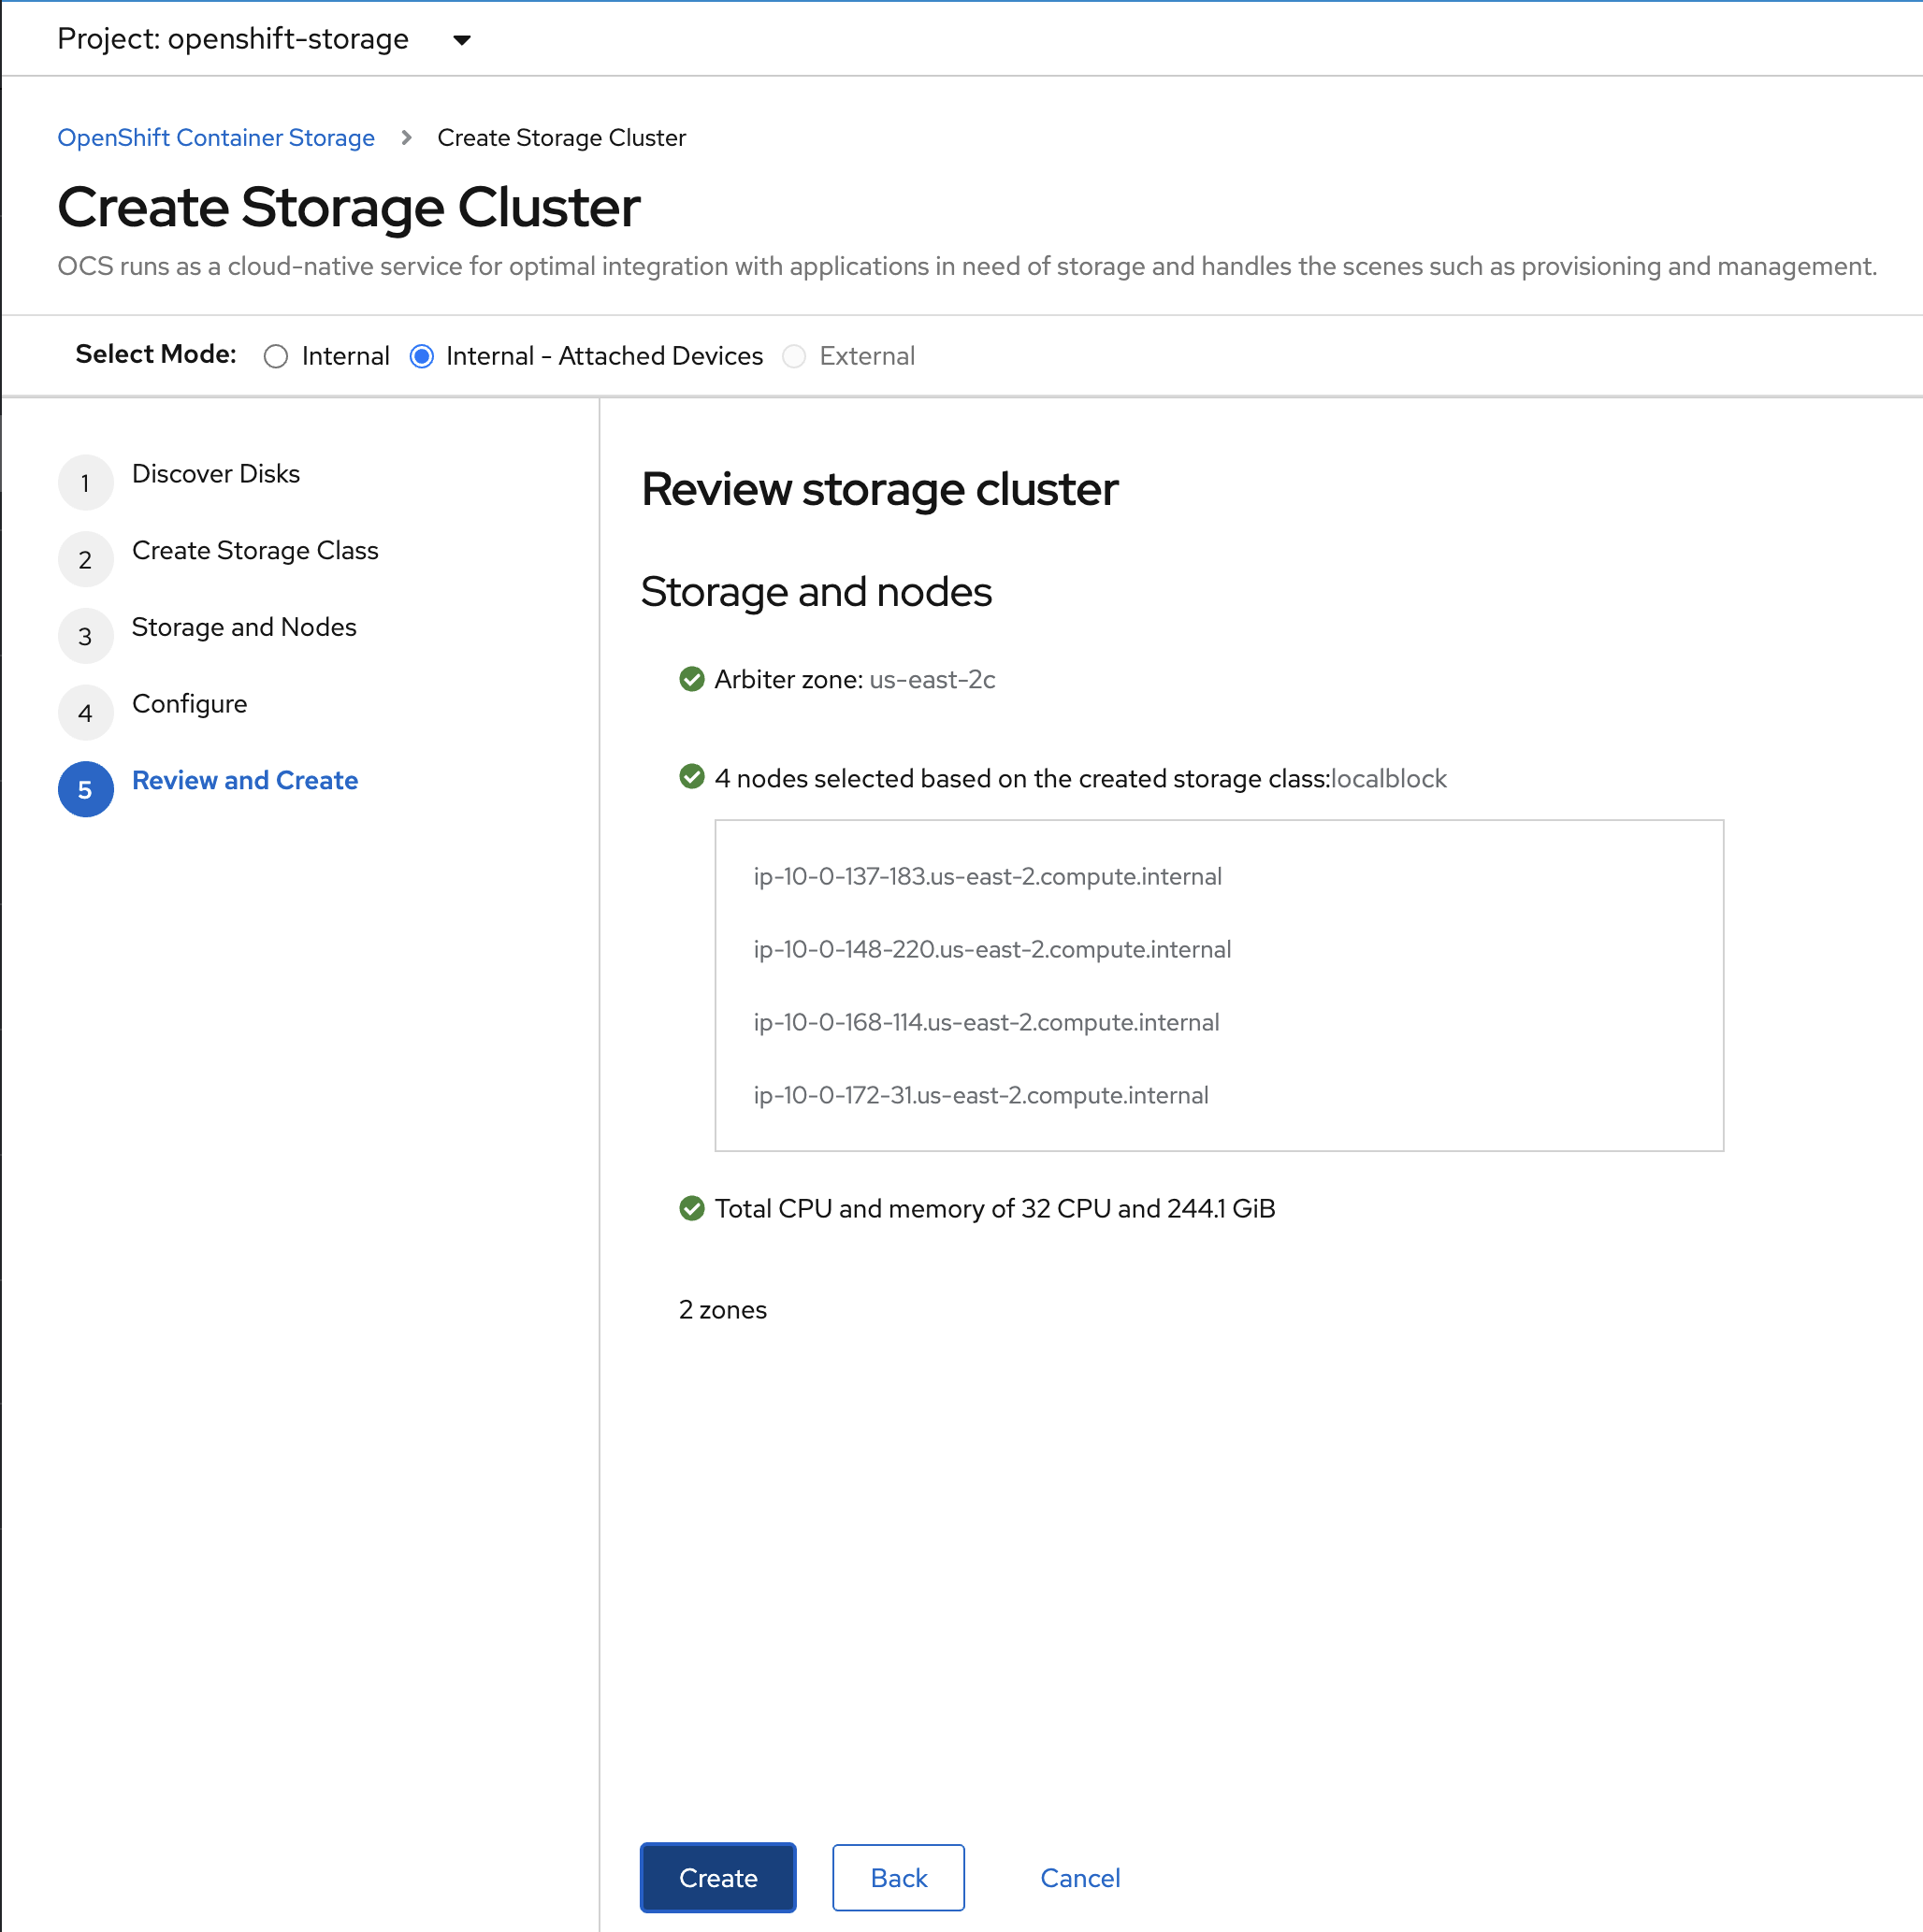
Click Create at the bottom of the Review storage cluster window.
5.2.1. Wait For Cluster Deployment
| The UI method requires the Arbiter mode to be configured with LSO based storage. |
Wait for your storage cluster to become operational.
oc get cephcluster -n openshift-storageNAME DATADIRHOSTPATH MONCOUNT AGE PHASE MESSAGE HEALTH
ocs-storagecluster-cephcluster /var/lib/rook 5 4m55s Ready Cluster created successfully HEALTH_OKoc get pods -n openshift-storageNAME READY STATUS RESTARTS AGE
csi-cephfsplugin-28n69 3/3 Running 0 5m34s
csi-cephfsplugin-5qfrr 3/3 Running 0 5m34s
csi-cephfsplugin-provisioner-6976556bd7-5nvzz 6/6 Running 0 5m34s
csi-cephfsplugin-provisioner-6976556bd7-z2g7w 6/6 Running 0 5m34s
csi-cephfsplugin-qwzbs 3/3 Running 0 5m34s
csi-cephfsplugin-wrrm5 3/3 Running 0 5m34s
csi-rbdplugin-44bxs 3/3 Running 0 5m35s
csi-rbdplugin-lzc2x 3/3 Running 0 5m35s
csi-rbdplugin-mdm4n 3/3 Running 0 5m35s
csi-rbdplugin-provisioner-6b8557bd8b-54kvr 6/6 Running 0 5m35s
csi-rbdplugin-provisioner-6b8557bd8b-k24sd 6/6 Running 0 5m35s
csi-rbdplugin-v66cl 3/3 Running 0 5m35s
noobaa-core-0 1/1 Running 0 2m23s
noobaa-db-pg-0 1/1 Running 0 2m23s
noobaa-endpoint-cf67f6789-tlmmg 1/1 Running 0 43s
noobaa-operator-746ddfc79-fcrfz 1/1 Running 0 66m
ocs-metrics-exporter-54b6d689f8-ltxvp 1/1 Running 0 66m
ocs-operator-5bcdd97ff4-rgn7f 1/1 Running 0 66m
rook-ceph-crashcollector-ip-10-0-137-183-5859f89db8-56tzl 1/1 Running 0 4m20s
rook-ceph-crashcollector-ip-10-0-148-220-66d4b9868d-wpdgz 1/1 Running 0 4m37s
rook-ceph-crashcollector-ip-10-0-168-114-6dc89c87d8-l2ckg 1/1 Running 0 4m52s
rook-ceph-crashcollector-ip-10-0-172-31-58dd45f7b9-wfjjv 1/1 Running 0 5m8s
rook-ceph-crashcollector-ip-10-0-212-112-67bcbb8949-vpn6h 1/1 Running 0 4m5s
rook-ceph-mds-ocs-storagecluster-cephfilesystem-a-64f7cb6dhb68v 2/2 Running 0 2m4s
rook-ceph-mds-ocs-storagecluster-cephfilesystem-b-96fd85c5vcbhn 2/2 Running 0 2m3s
rook-ceph-mgr-a-55f6d78b6b-9nvzr 2/2 Running 0 3m4s
rook-ceph-mon-a-599568d496-cqfxb 2/2 Running 0 5m9s
rook-ceph-mon-b-5b56c99655-m69s2 2/2 Running 0 4m52s
rook-ceph-mon-c-5854699cbd-76lrv 2/2 Running 0 4m37s
rook-ceph-mon-d-765776ccfc-46qpn 2/2 Running 0 4m20s
rook-ceph-mon-e-6bdd6d6bb8-wxwkf 2/2 Running 0 4m5s
rook-ceph-operator-7dd585bd97-sldkk 1/1 Running 0 66m
rook-ceph-osd-0-d75955974-qk5l9 2/2 Running 0 2m43s
rook-ceph-osd-1-7f886fd54-bgjzp 2/2 Running 0 2m42s
rook-ceph-osd-2-546d7986d-n52px 2/2 Running 0 2m42s
rook-ceph-osd-3-666b86f659-sln5d 2/2 Running 0 2m34s
rook-ceph-osd-prepare-ocs-deviceset-localblock-0-data-0ptfjctn6 0/1 Completed 0 3m3s
rook-ceph-osd-prepare-ocs-deviceset-localblock-1-data-0ffsr9kf5 0/1 Completed 0 3m2s
rook-ceph-osd-prepare-ocs-deviceset-localblock-2-data-0mzrl7rrl 0/1 Completed 0 3m2s
rook-ceph-osd-prepare-ocs-deviceset-localblock-3-data-0j7md76tl 0/1 Completed 0 3m1s5.3. Verify Deployment
Deploy the rook-ceph-tool pod.
oc patch ODFInitialization ocsinit -n openshift-storage --type json --patch '[{ "op": "replace", "path": "/spec/enableCephTools", "value": true }]'Establish a remote shell to the toolbox pod.
TOOLS_POD=$(oc get pods -n openshift-storage -l app=rook-ceph-tools -o name)
oc rsh -n openshift-storage $TOOLS_POD ceph status
oc rsh -n openshift-storage $TOOLS_POD ceph osd tree
Run ceph status and ceph osd tree to see that status of the cluster.
  cluster:
    id:     5f83a66c-3454-474f-9745-8205f01ea504
    health: HEALTH_OK

  services:
    mon: 5 daemons, quorum a,b,c,d,e (age 4m)
    mgr: a(active, since 4m)
    mds: ocs-storagecluster-cephfilesystem:1 {0=ocs-storagecluster-cephfilesystem-a=up:active} 1 up:standby-replay
    osd: 4 osds: 4 up (since 4m), 4 in (since 4m)

  task status:
    scrub status:
        mds.ocs-storagecluster-cephfilesystem-a: idle
        mds.ocs-storagecluster-cephfilesystem-b: idle

  data:
    pools:   3 pools, 192 pgs
    objects: 86 objects, 120 MiB
    usage:   4.2 GiB used, 9.1 TiB / 9.1 TiB avail
    pgs:     192 active+clean

  io:
    client:   853 B/s rd, 1023 B/s wr, 1 op/s rd, 0 op/s wr

ID  CLASS WEIGHT  TYPE NAME                        STATUS REWEIGHT PRI-AFF
 -1       9.09479 root default
 -5       9.09479     region us-east-2
-10       4.54739         zone us-east-2a
 -9       2.27370             host ip-10-0-137-183
  2   ssd 2.27370                 osd.2                up  1.00000 1.00000
-13       2.27370             host ip-10-0-148-220
  1   ssd 2.27370                 osd.1                up  1.00000 1.00000
 -4       4.54739         zone us-east-2b
-15       2.27370             host ip-10-0-168-114
  3   ssd 2.27370                 osd.3                up  1.00000 1.00000
 -3       2.27370             host ip-10-0-172-31
0 ssd 2.27370 osd.0 up 1.00000 1.00000| As observed the cluster in Arbiter node is always deployed with 5 Monitors, 2 per active OSD failure domain and one in the Arbiter failure domain. |
| OSDs are deployed in sets of 4, 2 per failure domain. |
6. Sample Application Deployment
In order to test failing over from one OCP cluster to another we need a simple application to and verify that replication is working.
Start by creating a new project on the primary cluster:
oc new-project my-database-appThen use the rails-pgsql-persistent template to create the new application. The new postgresql volume will be claimed from the new StorageClass.
curl -s https://raw.githubusercontent.com/red-hat-storage/ocs-training/master/training/modules/ocs4/attachments/configurable-rails-app.yaml | oc new-app -p STORAGE_CLASS=ocs-storagecluster-ceph-rbd -p VOLUME_CAPACITY=5Gi -f -After the deployment is started you can monitor with these commands.
oc statusCheck the PVC is created.
oc get pvc -n my-database-appThis step could take 5 or more minutes. Wait until there are 2 Pods in
Running STATUS and 4 Pods in Completed STATUS as shown below.
watch oc get pods -n my-database-appNAME READY STATUS RESTARTS AGE
postgresql-1-674qv 1/1 Running 0 3m1s
postgresql-1-deploy 0/1 Completed 0 3m4s
rails-pgsql-persistent-1-build 0/1 Completed 0 3m6s
rails-pgsql-persistent-1-deploy 0/1 Completed 0 100s
rails-pgsql-persistent-1-hook-pre 0/1 Completed 0 97s
rails-pgsql-persistent-1-rxzg2 1/1 Running 0 85sYou can exit by pressing Ctrl+C.
Once the deployment is complete you can now test the application and the persistent storage on OCS.
oc get route rails-pgsql-persistent -n my-database-app -o jsonpath --template="http://{.spec.host}/articles{'\n'}"This will return a route similar to this one.
http://rails-pgsql-persistent-my-database-app.apps.ocp45.ocstraining.com/articlesCopy your route (different than above) to a browser window to create articles.
Click the New Article link.
Enter the username and password below to create articles and comments.
The articles and comments are saved in a PostgreSQL database which stores its
table spaces on the RBD volume provisioned using the
ocs-storagecluster-ceph-rbd StorageClass during the application
deployment.
username: openshift
password: secret
Once you have added a new article you can verify it exists in the postgresql database by issuing this command:
oc rsh -n my-database-app $(oc get pods -n my-database-app|grep postgresql | grep -v deploy | awk {'print $1}') psql -c "\c root" -c "\d+" -c "select * from articles"You are now connected to database "root" as user "postgres".
List of relations
Schema | Name | Type | Owner | Size | Description
--------+----------------------+----------+---------+------------+-------------
public | ar_internal_metadata | table | user8EF | 16 kB |
public | articles | table | user8EF | 16 kB |
public | articles_id_seq | sequence | user8EF | 8192 bytes |
public | comments | table | user8EF | 8192 bytes |
public | comments_id_seq | sequence | user8EF | 8192 bytes |
public | schema_migrations | table | user8EF | 16 kB |
(6 rows)
id | title | body | created_at | updated_at
----+-------------------------------+------------------------------------------------------------------------------------+----------------------------+----------------------------
1 | Test Metro Stretch DR article | This article is to prove the data remains available once an entire zone goes down. | 2021-04-08 00:19:49.956903 | 2021-04-08 00:19:49.956903
(1 row)7. ARBITER Failure Test
This test is designed to demonstrates that if the failure domain hosting the Monitor running in Arbiter mode is subject to a failure the application remains available at all time. Both RPO and RTO are equal to 0.
Identify the node name for the master node in zone us-east-2c.
export masternode=$(oc get nodes -l node-role.kubernetes.io/master -l topology.kubernetes.io/zone=us-east-2c --no-headers | awk '{ print $1 }')
echo $masternodeip-10-0-207-228.us-east-2.compute.internalIdentify the Monitor that runs on a master node in zone us-east-2c.
oc get pods -n openshift-storage -o wide | grep ${masternode} | grep 'ceph-mon' | awk '{ print $1 }'rook-ceph-mon-e-cd6988b6-m8c2pShutdown the node where rook-ceph-mon-e-cd6988b6-m8c2p is running.
Identify the AWS InstanceId for this master node.
export instanceid=$(oc get machines -n openshift-machine-api -o wide | grep ${masternode} | awk '{ print $8 }' | cut -f 5 -d '/')
echo ${instanceid}i-00485f3056a71c1bcStop the instance
aws ec2 stop-instances --instance-ids ${instanceid}{
"StoppingInstances": [
{
"CurrentState": {
"Code": 64,
"Name": "stopping"
},
"InstanceId": "i-00485f3056a71c1bc",
"PreviousState": {
"Code": 16,
"Name": "running"
}
}
]
}Verify the master node is now stopped and the monitor not in a Running state.
oc get nodesNAME STATUS ROLES AGE VERSION
ip-10-0-150-108.us-east-2.compute.internal Ready worker 161m v1.20.0+bafe72f
ip-10-0-155-110.us-east-2.compute.internal Ready master 5h57m v1.20.0+bafe72f
ip-10-0-158-73.us-east-2.compute.internal Ready worker 5h52m v1.20.0+bafe72f
ip-10-0-163-32.us-east-2.compute.internal Ready master 5h56m v1.20.0+bafe72f
ip-10-0-172-113.us-east-2.compute.internal Ready worker 5h49m v1.20.0+bafe72f
ip-10-0-179-14.us-east-2.compute.internal Ready worker 161m v1.20.0+bafe72f
ip-10-0-207-228.us-east-2.compute.internal NotReady master 5h57m v1.20.0+bafe72fVerify the Monitor is not in a Running State.
oc get pods -n openshift-storage | grep 'ceph-mon'rook-ceph-mon-a-5f8568646-sxv4p 2/2 Running 0 146m
rook-ceph-mon-b-57dfb9b66c-8klfx 2/2 Running 0 146m
rook-ceph-mon-c-59c5b4749b-4gvv8 2/2 Running 0 146m
rook-ceph-mon-d-5d45c796bc-cmtgh 2/2 Running 0 146m
rook-ceph-mon-e-cd6988b6-9lz8b 0/2 Pending 0 3m34sNow verify the application can still be accessed.
oc rsh -n my-database-app $(oc get pods -n my-database-app|grep postgresql | grep -v deploy | awk {'print $1}') psql -c "\c root" -c "\d+" -c "select * from articles"You are now connected to database "root" as user "postgres".
List of relations
Schema | Name | Type | Owner | Size | Description
--------+----------------------+----------+---------+------------+-------------
public | ar_internal_metadata | table | user8EF | 16 kB |
public | articles | table | user8EF | 16 kB |
public | articles_id_seq | sequence | user8EF | 8192 bytes |
public | comments | table | user8EF | 8192 bytes |
public | comments_id_seq | sequence | user8EF | 8192 bytes |
public | schema_migrations | table | user8EF | 16 kB |
(6 rows)
id | title | body | created_at | updated_at
----+-------------------------------+------------------------------------------------------------------------------------+----------------------------+----------------------------
1 | Test Metro Stretch DR article | This article is to prove the data remains available once an entire zone goes down. | 2021-04-08 00:19:49.956903 | 2021-04-08 00:19:49.956903
(1 row)| The output is identical to the one performed when we tested the successfull deployment of the application. |
Restart the AWS instance.
aws ec2 start-instances --instance-ids ${instanceid}{
"StartingInstances": [
{
"CurrentState": {
"Code": 0,
"Name": "pending"
},
"InstanceId": "i-00485f3056a71c1bc",
"PreviousState": {
"Code": 80,
"Name": "stopped"
}
}
]
}Verify all Monitors are up and running again.
oc get pods -n openshift-storage | grep 'ceph-mon'rook-ceph-mon-a-5f8568646-sxv4p 2/2 Running 0 152m
rook-ceph-mon-b-57dfb9b66c-8klfx 2/2 Running 0 151m
rook-ceph-mon-c-59c5b4749b-4gvv8 2/2 Running 0 151m
rook-ceph-mon-d-5d45c796bc-cmtgh 2/2 Running 0 151m
rook-ceph-mon-e-cd6988b6-9lz8b 2/2 Running 0 8m59s8. DC Not Hosting Application Failure Test
This test is designed to demonstrates that if an application runs in the failure domain that is not impacted by the failure, the application remains available at all time. Both RPO and RTO are equal to 0.
Identify the node name where the application pod is running together with the zone in which the node is located.
export appnode=$(oc get pod -n my-database-app -o wide | grep Running | grep postgre | awk '{ print $7 }')
echo $appnodeip-10-0-158-73.us-east-2.compute.internalIdentify the availability zone the node belongs to and set a variable for the zone to shutdown.
export appzone=$(oc get node ${appnode} -o jsonpath='{.metadata.labels.topology\.kubernetes\.io/zone}')
if [ x"$appzone" == "xus-east-2a" ]; then shutzone="us-east-2b"; else shutzone="us-east-2a"; fi
echo "Application in zone ${appzone}; Shutting down zone ${shutzone}"Application in zone us-east-2a; Shutting down zone us-east-2bShutdown the nodes of the zone where the application is not running.
Identify the AWS `InstanceId`s and shut them down.
for instanceid in $(oc get machines -n openshift-machine-api -o wide | grep ${shutzone} | grep -v master | awk '{ print $8 }' | cut -f 5 -d '/')
do
echo Shutting down ${instanceid}
aws ec2 stop-instances --instance-ids ${instanceid}
doneShutting down i-0a3a7885a211a2b6d
{
"StoppingInstances": [
{
"CurrentState": {
"Code": 64,
"Name": "stopping"
},
"InstanceId": "i-0a3a7885a211a2b6d",
"PreviousState": {
"Code": 16,
"Name": "running"
}
}
]
}
Shutting down i-0e31b4d74c583a6c1
{
"StoppingInstances": [
{
"CurrentState": {
"Code": 64,
"Name": "stopping"
},
"InstanceId": "i-0e31b4d74c583a6c1",
"PreviousState": {
"Code": 16,
"Name": "running"
}
}
]
}Verify the worker nodes are now stopped and ODF pods are not running.
oc get nodesNAME STATUS ROLES AGE VERSION
ip-10-0-150-108.us-east-2.compute.internal Ready worker 4h15m v1.20.0+bafe72f
ip-10-0-155-110.us-east-2.compute.internal Ready master 7h31m v1.20.0+bafe72f
ip-10-0-158-73.us-east-2.compute.internal Ready worker 7h26m v1.20.0+bafe72f
ip-10-0-163-32.us-east-2.compute.internal Ready master 7h30m v1.20.0+bafe72f
ip-10-0-172-113.us-east-2.compute.internal NotReady worker 7h24m v1.20.0+bafe72f
ip-10-0-179-14.us-east-2.compute.internal NotReady worker 4h16m v1.20.0+bafe72f
ip-10-0-207-228.us-east-2.compute.internal Ready master 7h31m v1.20.0+bafe72fVerify the status of the pods impacted by the failure.
oc get pods -n openshift-storage | grep -v RunningNAME READY STATUS RESTARTS AGE
noobaa-core-0 1/1 Terminating 0 4h1m
noobaa-db-pg-0 1/1 Terminating 0 4h1m
noobaa-endpoint-8888f5c66-h95th 1/1 Terminating 0 4h
ocs-metrics-exporter-54b6d689f8-5jtgv 1/1 Terminating 0 4h6m
ocs-operator-5bcdd97ff4-kvp2z 1/1 Terminating 0 4h6m
rook-ceph-mds-ocs-storagecluster-cephfilesystem-b-7456b64dth86s 0/2 Pending 0 2m22s
rook-ceph-mon-c-59c5b4749b-mm7k5 0/2 Pending 0 2m22s
rook-ceph-mon-d-5d45c796bc-4vpwz 0/2 Pending 0 2m12s
rook-ceph-osd-2-6c57b8946f-6zl5x 0/2 Pending 0 2m12s
rook-ceph-osd-3-6f7dd55b9f-b48f8 0/2 Pending 0 2m22s
rook-ceph-osd-prepare-ocs-deviceset-gp2-0-data-0nvmg7-7w6nf 0/1 Completed 0 4h2m
rook-ceph-osd-prepare-ocs-deviceset-gp2-3-data-02bsqw-n98t9 0/1 Completed 0 4h2m
It will take over 5 minutes for the ODF pods to change status as the underlying node kubelet
can not report their status.
|
Verify the status of the ODF cluster by connecting to the toolbox pod.
TOOLS_POD=$(oc get pods -n openshift-storage -l app=rook-ceph-tools -o name)
oc rsh -n openshift-storage $TOOLS_POD ceph status cluster:
id: bb24312f-df33-455a-ae74-dc974a7572cd
health: HEALTH_WARN
insufficient standby MDS daemons available
We are missing stretch mode buckets, only requiring 1 of 2 buckets to peer
2 osds down
2 hosts (2 osds) down
1 zone (2 osds) down
Degraded data redundancy: 278/556 objects degraded (50.000%), 86 pgs degraded, 192 pgs undersized
2/5 mons down, quorum a,b,e
services:
mon: 5 daemons, quorum a,b,e (age 4m), out of quorum: c, d
mgr: a(active, since 3h)
mds: ocs-storagecluster-cephfilesystem:1 {0=ocs-storagecluster-cephfilesystem-a=up:active}
osd: 4 osds: 2 up (since 5m), 4 in (since 3h)
task status:
scrub status:
mds.ocs-storagecluster-cephfilesystem-a: idle
data:
pools: 3 pools, 192 pgs
objects: 139 objects, 259 MiB
usage: 4.7 GiB used, 2.0 TiB / 2 TiB avail
pgs: 278/556 objects degraded (50.000%)
106 active+undersized
86 active+undersized+degraded
io:
client: 5.3 KiB/s wr, 0 op/s rd, 0 op/s wr| As you can see, 2 OSDs are down, 2 MONs are down but we will now verify that the application os still responding. |
Now verify the application can still be accessed.
Add a new article via the application Web UI to verify the application is still available and data can be written
to the database. Once you have added a new article you can verify it exists in the postgresql database by issuing this command:
oc rsh -n my-database-app $(oc get pods -n my-database-app|grep postgresql | grep -v deploy | awk {'print $1}') psql -c "\c root" -c "\d+" -c "select * from articles"You are now connected to database "root" as user "postgres".
List of relations
Schema | Name | Type | Owner | Size | Description
--------+----------------------+----------+---------+------------+-------------
public | ar_internal_metadata | table | user8EF | 16 kB |
public | articles | table | user8EF | 16 kB |
public | articles_id_seq | sequence | user8EF | 8192 bytes |
public | comments | table | user8EF | 8192 bytes |
public | comments_id_seq | sequence | user8EF | 8192 bytes |
public | schema_migrations | table | user8EF | 16 kB |
(6 rows)
id | title | body | created_at | updated_at
----+--------------------------------+------------------------------------------------------------------------------------+----------------------------+----------------------------
1 | Test Metro Stretch DR article | This article is to prove the data remains available once an entire zone goes down. | 2021-04-08 00:19:49.956903 | 2021-04-08 00:19:49.956903
2 | Article Added During Failure 1 | This is to verify the application remains available. | 2021-04-08 02:35:48.380815 | 2021-04-08 02:35:48.380815
(2 rows)Restart the instances that we stop.
for instanceid in $(oc get machines -n openshift-machine-api -o wide | grep ${shutzone} | grep -v master | awk '{ print $8 }' | cut -f 5 -d '/')
do
echo Starting ${instanceid}
aws ec2 start-instances --instance-ids ${instanceid}
doneStarting i-0a3a7885a211a2b6d
{
"StartingInstances": [
{
"CurrentState": {
"Code": 0,
"Name": "pending"
},
"InstanceId": "i-0a3a7885a211a2b6d",
"PreviousState": {
"Code": 80,
"Name": "stopped"
}
}
]
}
Starting i-0e31b4d74c583a6c1
{
"StartingInstances": [
{
"CurrentState": {
"Code": 0,
"Name": "pending"
},
"InstanceId": "i-0e31b4d74c583a6c1",
"PreviousState": {
"Code": 80,
"Name": "stopped"
}
}
]
}Verify the worker nodes are now started and ODF pods are now running.
oc get nodesNAME STATUS ROLES AGE VERSION
ip-10-0-150-108.us-east-2.compute.internal Ready worker 4h30m v1.20.0+bafe72f
ip-10-0-155-110.us-east-2.compute.internal Ready master 7h46m v1.20.0+bafe72f
ip-10-0-158-73.us-east-2.compute.internal Ready worker 7h42m v1.20.0+bafe72f
ip-10-0-163-32.us-east-2.compute.internal Ready master 7h45m v1.20.0+bafe72f
ip-10-0-172-113.us-east-2.compute.internal Ready worker 7h39m v1.20.0+bafe72f
ip-10-0-179-14.us-east-2.compute.internal Ready worker 4h31m v1.20.0+bafe72f
ip-10-0-207-228.us-east-2.compute.internal Ready master 7h46m v1.20.0+bafe72fVerify the status of the ODF pods impacted by the failure. There should be none.
oc get pods -n openshift-storage | grep -v RunningNAME READY STATUS RESTARTS AGE
rook-ceph-osd-prepare-ocs-deviceset-gp2-0-data-0nvmg7-7w6nf 0/1 Completed 0 4h12m
rook-ceph-osd-prepare-ocs-deviceset-gp2-3-data-02bsqw-n98t9 0/1 Completed 0 4h12m
It make take about a minute or two before all pods are back in Running status.
|
Verify the status of the ODF cluster by connecting to the toolbox pod.
TOOLS_POD=$(oc get pods -n openshift-storage -l app=rook-ceph-tools -o name)
oc rsh -n openshift-storage $TOOLS_POD ceph status cluster:
id: bb24312f-df33-455a-ae74-dc974a7572cd
health: HEALTH_OK
services:
mon: 5 daemons, quorum a,b,c,d,e (age 3m)
mgr: a(active, since 4h)
mds: ocs-storagecluster-cephfilesystem:1 {0=ocs-storagecluster-cephfilesystem-a=up:active} 1 up:standby-replay
osd: 4 osds: 4 up (since 3m), 4 in (since 4h)
task status:
scrub status:
mds.ocs-storagecluster-cephfilesystem-a: idle
mds.ocs-storagecluster-cephfilesystem-b: idle
data:
pools: 3 pools, 192 pgs
objects: 142 objects, 267 MiB
usage: 4.7 GiB used, 2.0 TiB / 2 TiB avail
pgs: 192 active+clean
io:
client: 1.2 KiB/s rd, 14 KiB/s wr, 2 op/s rd, 1 op/s wr
It make take about a minute or two before all pods are back in Running status
and the ODF cluster returns to HEALTH_OK.
|
9. DC Hosting Application Failure Test
This test is designed to demonstrates that if an application runs in the failure domain that will become unavailable, the application is rescheduled on one of the remaining worker nodes in the surviving failure domain and becomes available again when the application pod is restarted. In this scenario the RPO is equal to 0 and the RTO is equal to the time (a matter of seconds) it takes to reschedule the application pod.
Identify the node name where the application pod is running together with the zone in which the node is located.
export appnode=$(oc get pod -n my-database-app -o wide | grep Running | grep postgre | awk '{ print $7 }')
echo $appnodeip-10-0-158-73.us-east-2.compute.internalIdentify the availability zone the node belongs to and set a variable for the zone to shutdown.
export appzone=$(oc get node ${appnode} -o jsonpath='{.metadata.labels.topology\.kubernetes\.io/zone}')
if [ x"$appzone" == "xus-east-2a" ]; then shutzone="us-east-2a"; else shutzone="us-east-2b"; fi
echo "Application in zone ${appzone}; Shutting down zone ${shutzone}"Application in zone us-east-2a; Shutting down zone us-east-2aShutdown the nodes of the zone where the application is not running.
Identify the AWS `InstanceId`s and shut them down.
for instanceid in $(oc get machines -n openshift-machine-api -o wide | grep ${shutzone} | grep -v master | awk '{ print $8 }' | cut -f 5 -d '/')
do
echo Shutting down ${instanceid}
aws ec2 stop-instances --instance-ids ${instanceid}
doneShutting down i-048512405b8d288c5
{
"StoppingInstances": [
{
"CurrentState": {
"Code": 64,
"Name": "stopping"
},
"InstanceId": "i-048512405b8d288c5",
"PreviousState": {
"Code": 16,
"Name": "running"
}
}
]
}
Shutting down i-01cdb6fe63f481043
{
"StoppingInstances": [
{
"CurrentState": {
"Code": 64,
"Name": "stopping"
},
"InstanceId": "i-01cdb6fe63f481043",
"PreviousState": {
"Code": 16,
"Name": "running"
}
}
]
}Verify the worker nodes are now stopped and ODF pods are not running.
oc get nodesNAME STATUS ROLES AGE VERSION
ip-10-0-150-108.us-east-2.compute.internal NotReady worker 4h38m v1.20.0+bafe72f
ip-10-0-155-110.us-east-2.compute.internal Ready master 7h53m v1.20.0+bafe72f
ip-10-0-158-73.us-east-2.compute.internal NotReady worker 7h49m v1.20.0+bafe72f
ip-10-0-163-32.us-east-2.compute.internal Ready master 7h53m v1.20.0+bafe72f
ip-10-0-172-113.us-east-2.compute.internal Ready worker 7h46m v1.20.0+bafe72f
ip-10-0-179-14.us-east-2.compute.internal Ready worker 4h38m v1.20.0+bafe72f
ip-10-0-207-228.us-east-2.compute.internal Ready master 7h53m v1.20.0+bafe72fVerify the status of the ODF pods impacted by the failure.
oc get pods -n openshift-storage | grep -v RunningNAME READY STATUS RESTARTS AGE
noobaa-core-0 1/1 Terminating 0 4h1m
noobaa-db-pg-0 1/1 Terminating 0 4h1m
noobaa-endpoint-8888f5c66-h95th 1/1 Terminating 0 4h
ocs-metrics-exporter-54b6d689f8-5jtgv 1/1 Terminating 0 4h6m
ocs-operator-5bcdd97ff4-kvp2z 1/1 Terminating 0 4h6m
rook-ceph-mds-ocs-storagecluster-cephfilesystem-b-7456b64dth86s 0/2 Pending 0 2m22s
rook-ceph-mon-c-59c5b4749b-mm7k5 0/2 Pending 0 2m22s
rook-ceph-mon-d-5d45c796bc-4vpwz 0/2 Pending 0 2m12s
rook-ceph-osd-2-6c57b8946f-6zl5x 0/2 Pending 0 2m12s
rook-ceph-osd-3-6f7dd55b9f-b48f8 0/2 Pending 0 2m22s
rook-ceph-osd-prepare-ocs-deviceset-gp2-0-data-0nvmg7-7w6nf 0/1 Completed 0 4h2m
rook-ceph-osd-prepare-ocs-deviceset-gp2-3-data-02bsqw-n98t9 0/1 Completed 0 4h2m
It will take over 5 minutes for the ODF pods to change status as the underlying node kubelet
can not report their status.
|
Verify the status of the ODF cluster by connecting to the toolbox pod.
TOOLS_POD=$(oc get pods -n openshift-storage -l app=rook-ceph-tools -o name)
oc rsh -n openshift-storage $TOOLS_POD ceph status cluster:
id: bb24312f-df33-455a-ae74-dc974a7572cd
health: HEALTH_WARN
1 filesystem is degraded
insufficient standby MDS daemons available
1 MDSs report slow metadata IOs
2 osds down
2 hosts (2 osds) down
1 zone (2 osds) down
Reduced data availability: 192 pgs inactive
Degraded data redundancy: 286/572 objects degraded (50.000%), 89 pgs degraded, 192 pgs undersized
2/5 mons down, quorum c,d,e
services:
mon: 5 daemons, quorum c,d,e (age 26s), out of quorum: a, b
mgr: a(active, since 64s)
mds: ocs-storagecluster-cephfilesystem:1/1 {0=ocs-storagecluster-cephfilesystem-b=up:replay}
osd: 4 osds: 2 up (since 6m), 4 in (since 4h)
data:
pools: 3 pools, 192 pgs
objects: 143 objects, 267 MiB
usage: 2.3 GiB used, 1022 GiB / 1 TiB avail
pgs: 100.000% pgs not active
286/572 objects degraded (50.000%)
103 undersized+peered
89 undersized+degraded+peered| If an error message is displayed when trying to connect to the toolbox, delete the current pod to force a restart of the pod. |
| As you can see, 2 OSDs are down, 2 MONs are down but we will now verify that the application os still responding. |
Now verify the application can still be accessed.
Add a new article via the application Web UI to verify the application is still available and data can be written
to the database. Once you have added a new article you can verify it exists in the postgresql database by issuing this command:
oc rsh -n my-database-app $(oc get pods -n my-database-app|grep postgresql | grep -v deploy | awk {'print $1}') psql -c "\c root" -c "\d+" -c "select * from articles"You are now connected to database "root" as user "postgres".
List of relations
Schema | Name | Type | Owner | Size | Description
--------+----------------------+----------+---------+------------+-------------
public | ar_internal_metadata | table | user8EF | 16 kB |
public | articles | table | user8EF | 16 kB |
public | articles_id_seq | sequence | user8EF | 8192 bytes |
public | comments | table | user8EF | 8192 bytes |
public | comments_id_seq | sequence | user8EF | 8192 bytes |
public | schema_migrations | table | user8EF | 16 kB |
(6 rows)
id | title | body | created_at | updated_at
----+--------------------------------+------------------------------------------------------------------------------------+----------------------------+----------------------------
1 | Test Metro Stretch DR article | This article is to prove the data remains available once an entire zone goes down. | 2021-04-08 00:19:49.956903 | 2021-04-08 00:19:49.956903
2 | Article Added During Failure 1 | This is to verify the application remains available. | 2021-04-08 02:35:48.380815 | 2021-04-08 02:35:48.380815
(2 rows)Restart the instances that we stopped.
for instanceid in $(oc get machines -n openshift-machine-api -o wide | grep ${shutzone} | grep -v master | awk '{ print $8 }' | cut -f 5 -d '/')
do
echo Starting ${instanceid}
aws ec2 start-instances --instance-ids ${instanceid}
doneStarting i-048512405b8d288c5
{
"StartingInstances": [
{
"CurrentState": {
"Code": 0,
"Name": "pending"
},
"InstanceId": "i-048512405b8d288c5",
"PreviousState": {
"Code": 80,
"Name": "stopped"
}
}
]
}
Starting i-01cdb6fe63f481043
{
"StartingInstances": [
{
"CurrentState": {
"Code": 0,
"Name": "pending"
},
"InstanceId": "i-01cdb6fe63f481043",
"PreviousState": {
"Code": 80,
"Name": "stopped"
}
}
]
}Verify the worker nodes are now started and ODF pods are now running.
oc get nodesNAME STATUS ROLES AGE VERSION
ip-10-0-150-108.us-east-2.compute.internal Ready worker 4h57m v1.20.0+bafe72f
ip-10-0-155-110.us-east-2.compute.internal Ready master 8h v1.20.0+bafe72f
ip-10-0-158-73.us-east-2.compute.internal Ready worker 8h v1.20.0+bafe72f
ip-10-0-163-32.us-east-2.compute.internal Ready master 8h v1.20.0+bafe72f
ip-10-0-172-113.us-east-2.compute.internal Ready worker 8h v1.20.0+bafe72f
ip-10-0-179-14.us-east-2.compute.internal Ready worker 4h57m v1.20.0+bafe72f
ip-10-0-207-228.us-east-2.compute.internal Ready master 8h v1.20.0+bafe72fVerify the status of the ODF pods impacted by the failure. There should be none.
oc get pods -n openshift-storage | grep -v RunningNAME READY STATUS RESTARTS AGE
It make take about a minute or two before all pods are back in Running status.
|
Verify the status of the ODF cluster by connecting to the toolbox pod.
TOOLS_POD=$(oc get pods -n openshift-storage -l app=rook-ceph-tools -o name)
oc rsh -n openshift-storage $TOOLS_POD ceph status cluster:
id: bb24312f-df33-455a-ae74-dc974a7572cd
health: HEALTH_OK
services:
mon: 5 daemons, quorum a,b,c,d,e (age 52s)
mgr: a(active, since 15m)
mds: ocs-storagecluster-cephfilesystem:1 {0=ocs-storagecluster-cephfilesystem-b=up:active} 1 up:standby-replay
osd: 4 osds: 4 up (since 64s), 4 in (since 4h)
task status:
scrub status:
mds.ocs-storagecluster-cephfilesystem-a: idle
data:
pools: 3 pools, 192 pgs
objects: 144 objects, 269 MiB
usage: 4.7 GiB used, 2.0 TiB / 2 TiB avail
pgs: 192 active+clean
io:
client: 141 KiB/s rd, 145 KiB/s wr, 8 op/s rd, 9 op/s wr
It make take about a minute or two before all pods are back in Running status
and the ODF cluster is back to HEALTH_OK status.
|