Deploying and Managing OpenShift Container Storage
1. Lab Overview
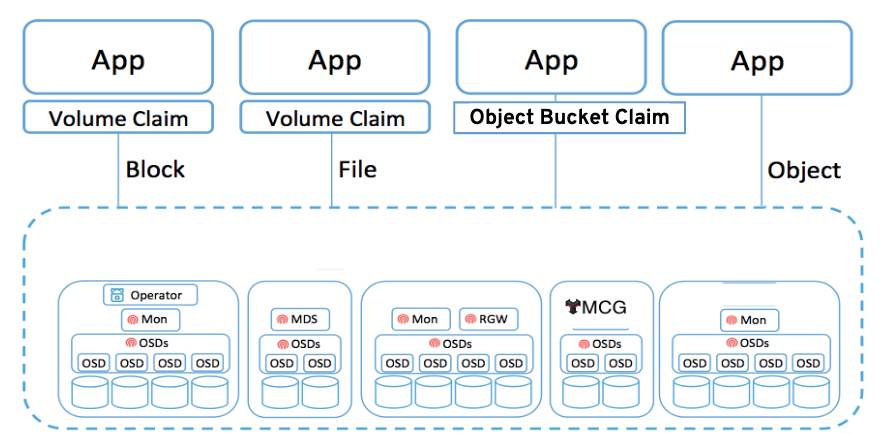
This module is for both system administrators and application developers interested in learning how to deploy and manage OpenShift Container Storage (OCS). In this module you will be using OpenShift Container Platform (OCP) 4.x and the OCS operator to deploy Ceph and the Multi-Cloud-Gateway (MCG) as a persistent storage solution for OCP workloads.
1.1. In this lab you will learn how to
-
Configure and deploy containerized Ceph and MCG
-
Validate deployment of containerized Ceph and MCG
-
Deploy the Rook toolbox to run Ceph and RADOS commands
-
Create an application using Read-Write-Once (RWO) PVC that is based on Ceph RBD
-
Create an application using Read-Write-Many (RWX) PVC that is based on CephFS
-
Use OCS for Prometheus and AlertManager storage
-
Use the MCG to create a bucket and use in an application
-
Add more storage to the Ceph cluster
-
Review OCS metrics and alerts
-
Use must-gather to collect support information
| If you want more information about how Ceph works please review Introduction to Ceph section before starting the exercises in this module. |
2. Deploy your storage backend using the OCS operator
2.1. Scale OCP cluster and add new worker nodes
In this section, you will first validate the OCP environment has 2 or 3 worker
nodes before increasing the cluster size by additional 3 worker nodes for OCS
resources. The NAME of your OCP nodes will be different than shown below.
oc get nodes -l node-role.kubernetes.io/worker -l '!node-role.kubernetes.io/master'NAME STATUS ROLES AGE VERSION
ip-10-0-153-37.us-east-2.compute.internal Ready worker 4d4h v1.19.0+9f84db3
ip-10-0-170-25.us-east-2.compute.internal Ready worker 4d4h v1.19.0+9f84db3Now you are going to add 3 more OCP compute nodes to cluster using machinesets.
oc get machinesets -n openshift-machine-apiThis will show you the existing machinesets used to create the 2 or 3 worker
nodes in the cluster already. There is a machineset for each of 3 AWS
Availability Zones (AZ). Your machinesets NAME will be different than
below. In the case of only 2 workers one of the machinesets will not have any
machines (i.e., DESIRED=0) created.
NAME                                        DESIRED   CURRENT   READY   AVAILABLE   AGE
cluster-ocs4-8613-bc282-worker-us-east-2a   1         1         1       1           4d4h
cluster-ocs4-8613-bc282-worker-us-east-2b   1         1         1       1           4d4h
cluster-ocs4-8613-bc282-worker-us-east-2c   0         0                             4d4h
Create new MachineSets that will in turn create storage-specific nodes for your OCP cluster in the AWS AZs:
| Make sure you do the next steps for finding and using your CLUSTERID |
CLUSTERID=$(oc get machineset -n openshift-machine-api -o jsonpath='{.items[0].metadata.labels.machine\.openshift\.io/cluster-api-cluster}')
echo $CLUSTERID
Similar to the infrastructure nodes lab, create new MachineSets that will run storage-specific nodes for your OCP cluster:
curl -s https://raw.githubusercontent.com/red-hat-storage/ocs-training/master/training/modules/ocs4/attachments/cluster-workerocs-us-east-2.yaml | sed -e "s/CLUSTERID/${CLUSTERID}/g" | oc apply -f -Check that you have new machines created.
oc get machines -n openshift-machine-api | egrep 'NAME|workerocs'They will be in Provisioning for sometime and eventually in a Running
PHASE. The NAME of your machines will be different than shown below.
NAME                                                 PHASE     TYPE          REGION      ZONE         AGE
cluster-ocs4-8613-bc282-workerocs-us-east-2a-g6cfz   Running   m5.4xlarge    us-east-2   us-east-2a   3m48s
cluster-ocs4-8613-bc282-workerocs-us-east-2b-2zdgx   Running   m5.4xlarge    us-east-2   us-east-2b   3m48s
cluster-ocs4-8613-bc282-workerocs-us-east-2c-gg7br   Running   m5.4xlarge    us-east-2   us-east-2c   3m48s
You can see that the workerocs machines are also using the AWS EC2 instance
type m5.4xlarge. The m5.4xlarge instance type has 16 cpus and 64 GB memory.
Now you want to see if our new machines are added to the OCP cluster.
watch "oc get machinesets -n openshift-machine-api | egrep 'NAME|workerocs'"This step could take more than 5 minutes. The result of this command needs to
look like below before you proceed. All new workerocs machinesets should
have an integer, in this case 1, filled out for all rows and under columns
READY and AVAILABLE. The NAME of your machinesets will be different
than shown below.
NAME                                           DESIRED   CURRENT   READY   AVAILABLE   AGE
cluster-ocs4-8613-bc282-workerocs-us-east-2a   1         1         1       1           16m
cluster-ocs4-8613-bc282-workerocs-us-east-2b   1         1         1       1           16m
cluster-ocs4-8613-bc282-workerocs-us-east-2c   1         1         1       1           16m
You can exit by pressing Ctrl+C.
Now check to see that you have 3 new OCP worker nodes. The NAME of your OCP
nodes will be different than shown below.
oc get nodes -l node-role.kubernetes.io/worker -l '!node-role.kubernetes.io/master'NAME STATUS ROLES AGE VERSION
ip-10-0-147-230.us-east-2.compute.internal Ready worker 14m v1.19.0+9f84db3
ip-10-0-153-37.us-east-2.compute.internal Ready worker 4d4h v1.19.0+9f84db3
ip-10-0-170-25.us-east-2.compute.internal Ready worker 4d4h v1.19.0+9f84db3
ip-10-0-175-8.us-east-2.compute.internal Ready worker 14m v1.19.0+9f84db3
ip-10-0-209-53.us-east-2.compute.internal Ready worker 14m v1.19.0+9f84db3Let’s check to make sure the new OCP nodes have the OCS label. This label was
added in the workerocs machinesets so every machine created using these
machinesets will have this label.
oc get nodes -l cluster.ocs.openshift.io/openshift-storage=NAME STATUS ROLES AGE VERSION
ip-10-0-147-230.us-east-2.compute.internal Ready worker 15m v1.19.0+9f84db3
ip-10-0-175-8.us-east-2.compute.internal Ready worker 15m v1.19.0+9f84db3
ip-10-0-209-53.us-east-2.compute.internal Ready worker 15m v1.19.0+9f84db32.2. Installing the OCS operator
In this section you will be using three of the worker OCP 4 nodes to deploy OCS 4 using the OCS Operator in OperatorHub. The following will be installed:
-
An OCS OperatorGroup
-
An OCS Subscription
-
All other OCS resources (Operators, Ceph Pods, NooBaa Pods, StorageClasses)
Start with creating the openshift-storage namespace.
oc create namespace openshift-storageYou must add the monitoring label to this namespace. This is required to get
prometheus metrics and alerts for the OCP storage dashboards. To label the
openshift-storage namespace use the following command:
oc label namespace openshift-storage "openshift.io/cluster-monitoring=true"
The creation of the openshift-storage namespace, and the monitoring
label added to this namespace, can also be done during the OCS operator
installation using the Openshift Web Console.
|
Now switch over to your Openshift Web Console. You can get your URL by
issuing command below to get the OCP 4 console route.
oc get -n openshift-console route consoleCopy the Openshift Web Console route to a browser tab and login using your cluster-admin username (i.e., kubadmin) and password.
Once you are logged in, navigate to the Operators → OperatorHub menu.
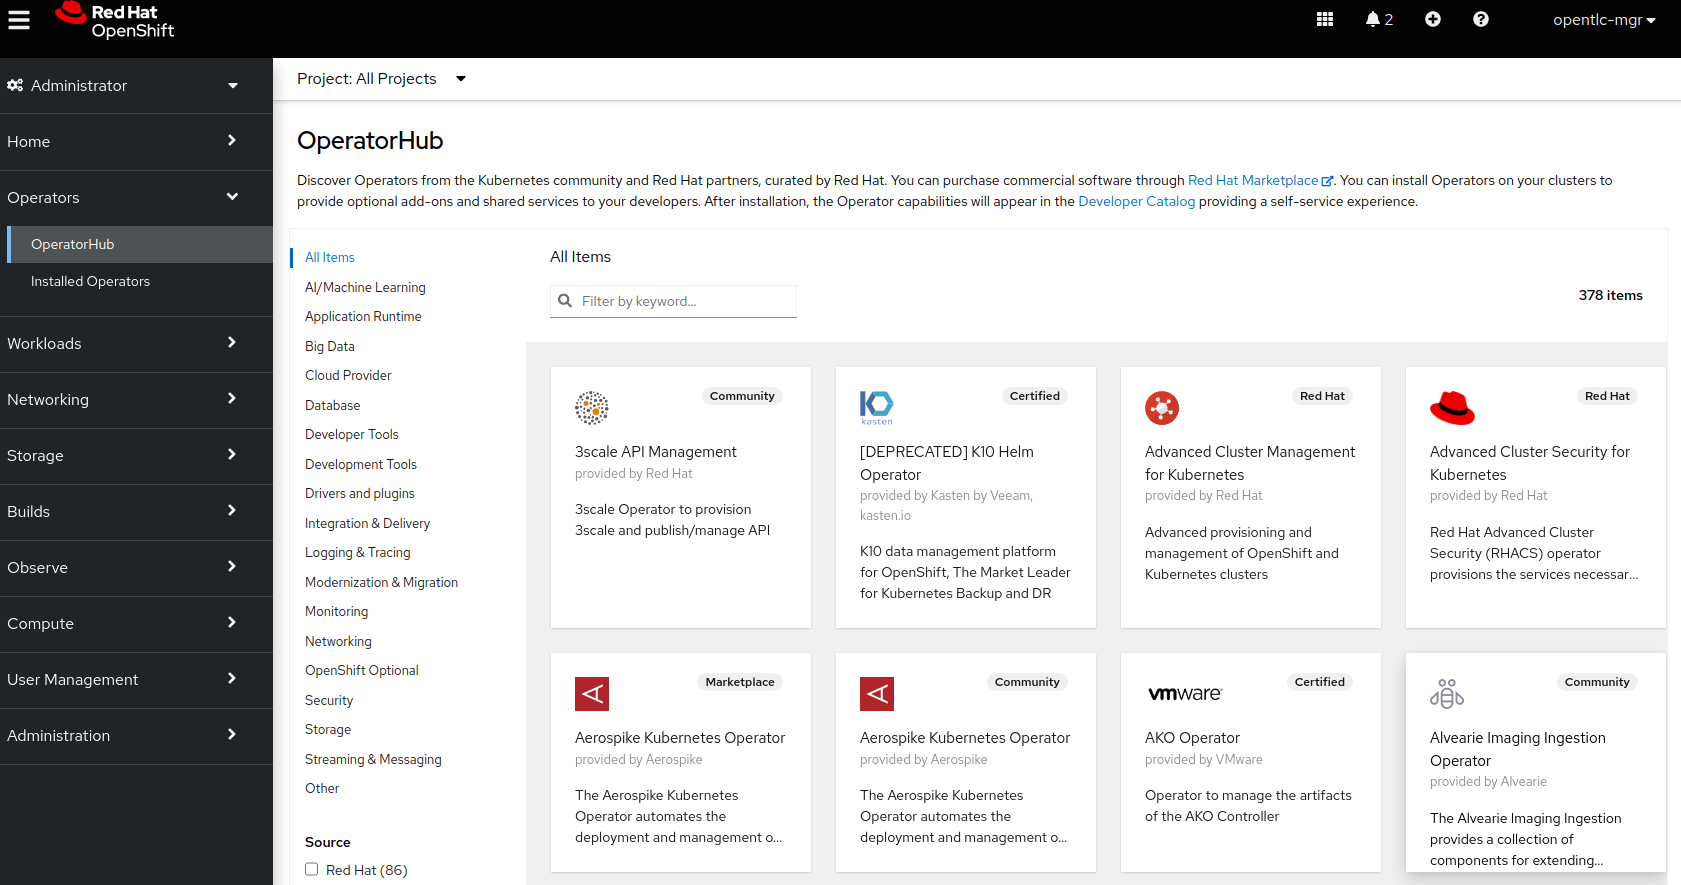
Now type openshift container storage in the Filter by keyword… box.
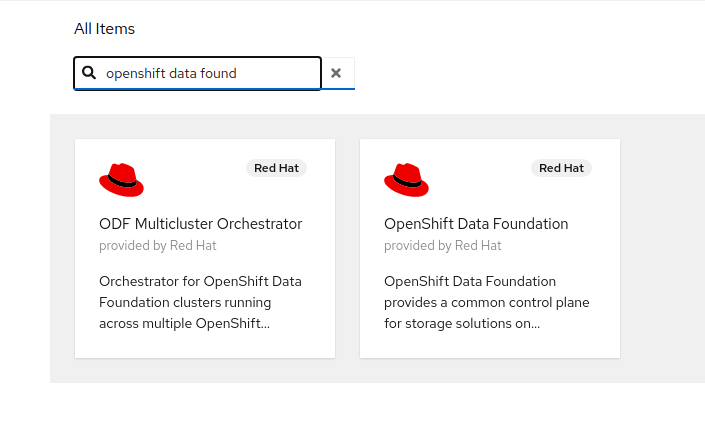
Select OpenShift Container Storage Operator and then select Install.
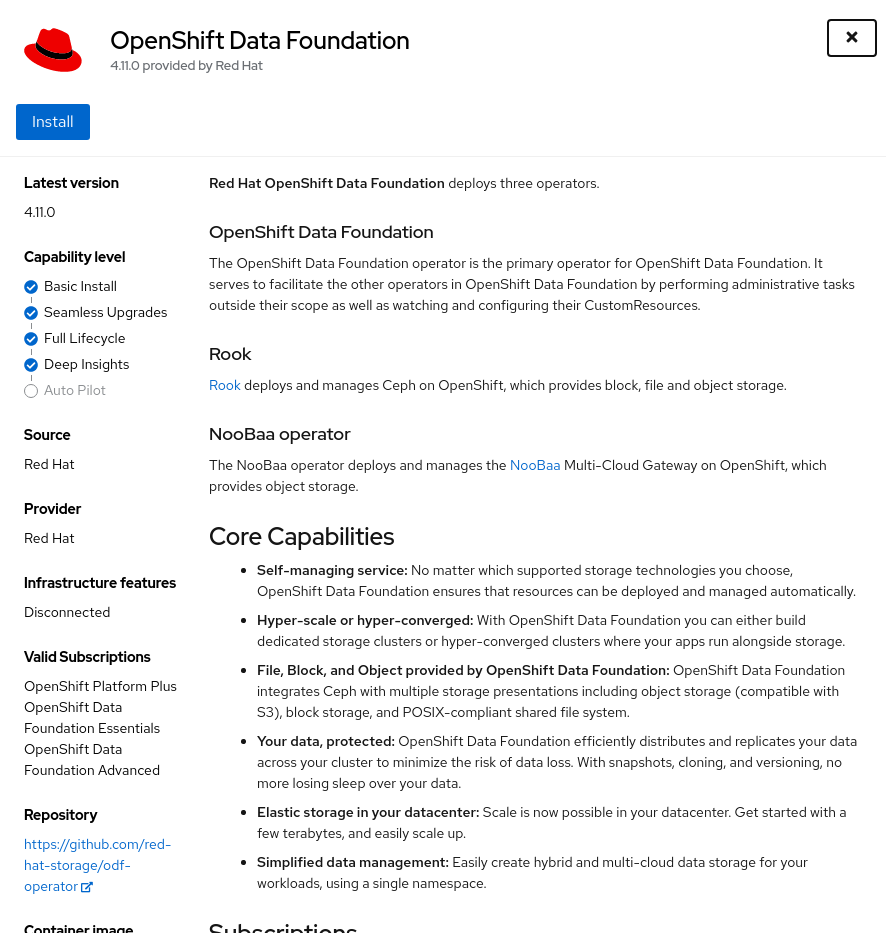
On the next screen make sure the settings are as shown in this figure.
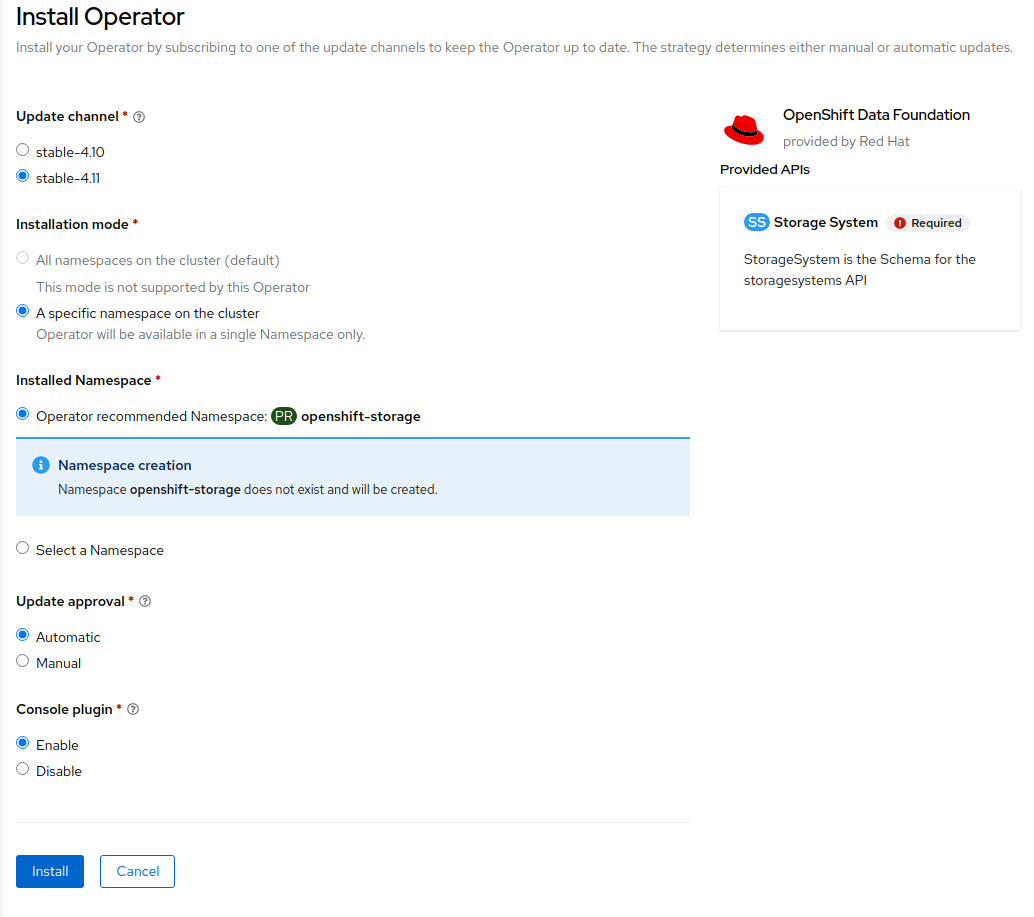
Click Install.
Now you can go back to your terminal window to check the progress of the installation.
watch oc -n openshift-storage get csvNAME DISPLAY VERSION REPLACES PHASE
ocs-operator.v4.7.2 OpenShift Container Storage 4.7.2 SucceededYou can exit by pressing Ctrl+C.
The resource csv is a shortened word for
clusterserviceversions.operators.coreos.com.
|
Please wait until the operator
This will mark that the installation of your operator was
successful. Reaching this state can take several minutes.
PHASE changes to Succeeded |
You will now also see new operator pods in openshift-storage
namespace:
oc -n openshift-storage get podsNAME READY STATUS RESTARTS AGE
noobaa-operator-698746cd47-sp6w9 1/1 Running 0 108s
ocs-metrics-exporter-78bc44687-pg4hk 1/1 Running 0 107s
ocs-operator-6d99bc6787-d7m9d 1/1 Running 0 108s
rook-ceph-operator-59f7fb95d6-sdjd8 1/1 Running 0 108sNow switch back to your Openshift Web Console for the remainder of the installation for OCS 4.
Select Create Storage Cluster in figure below to get to the OCS configuration screen.
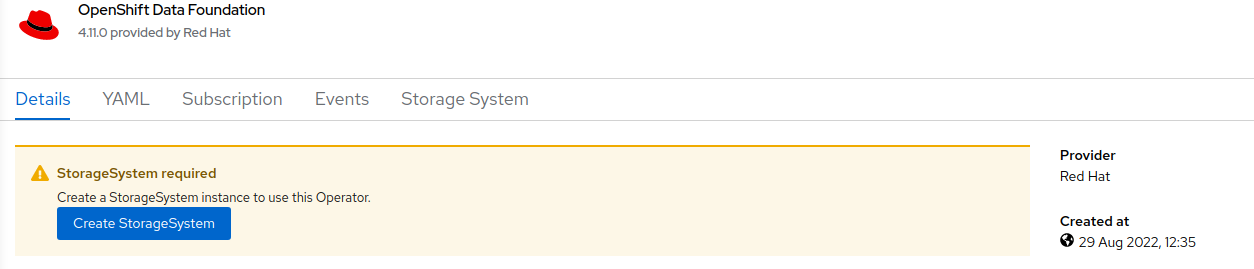
The Create Storage Cluster screen will display.
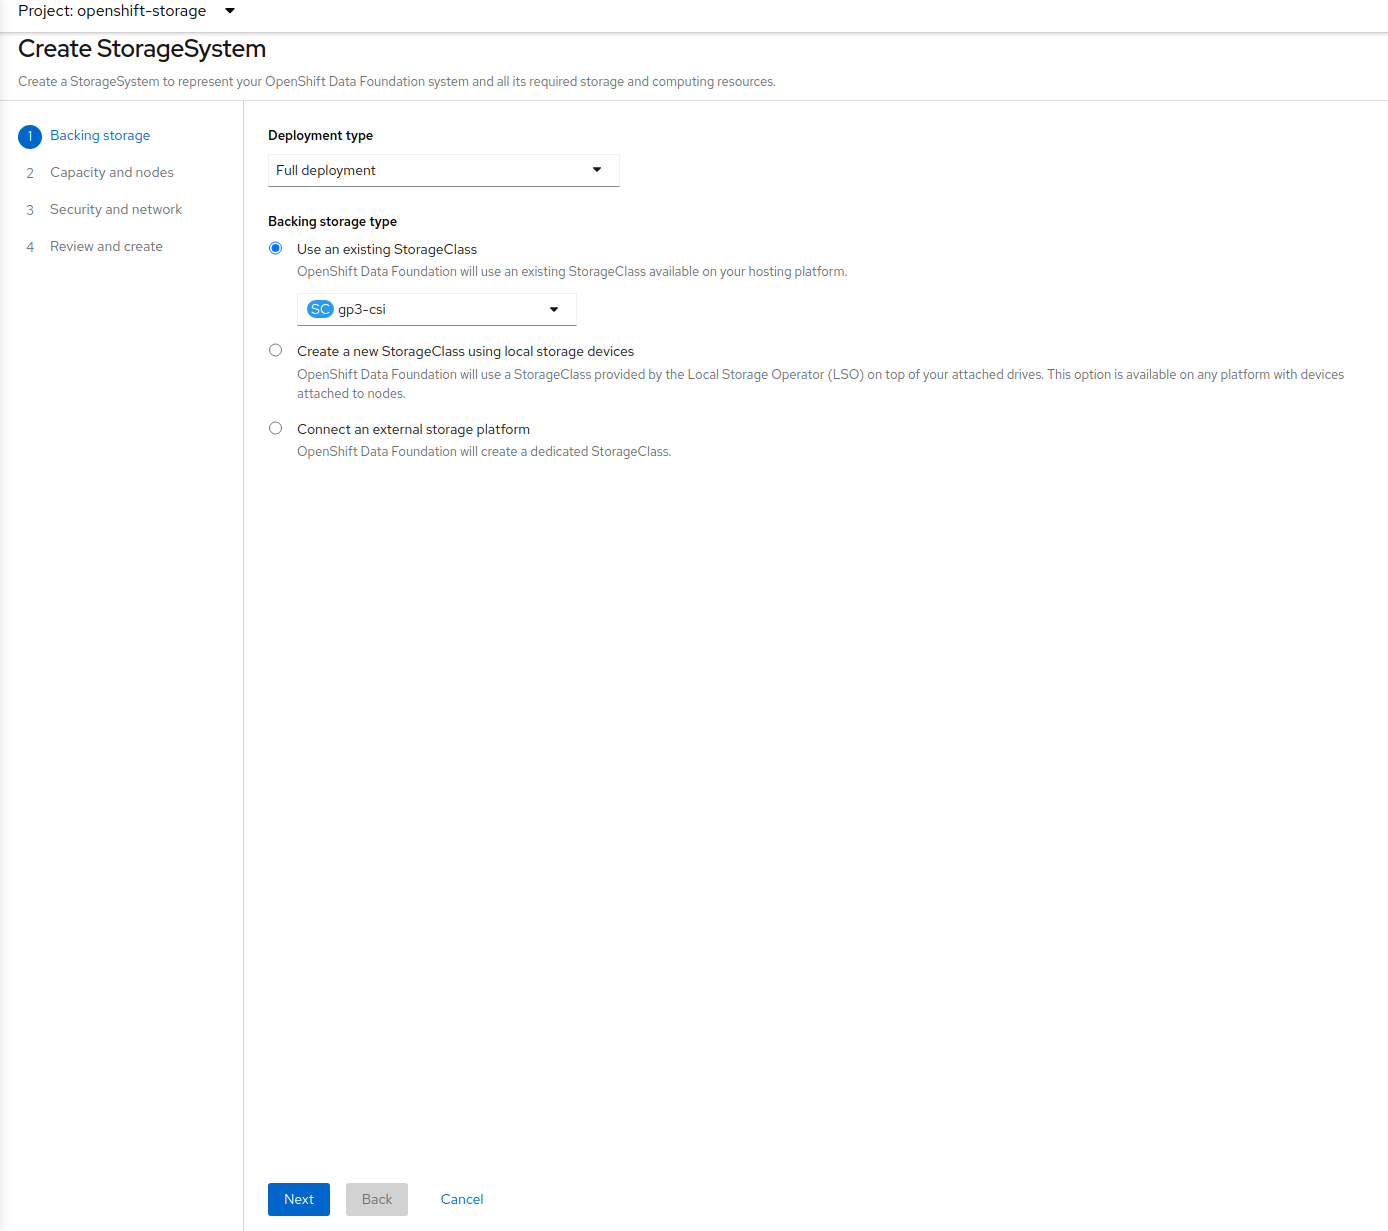
Leave the default selection of Internal, gp2, 2 TiB.
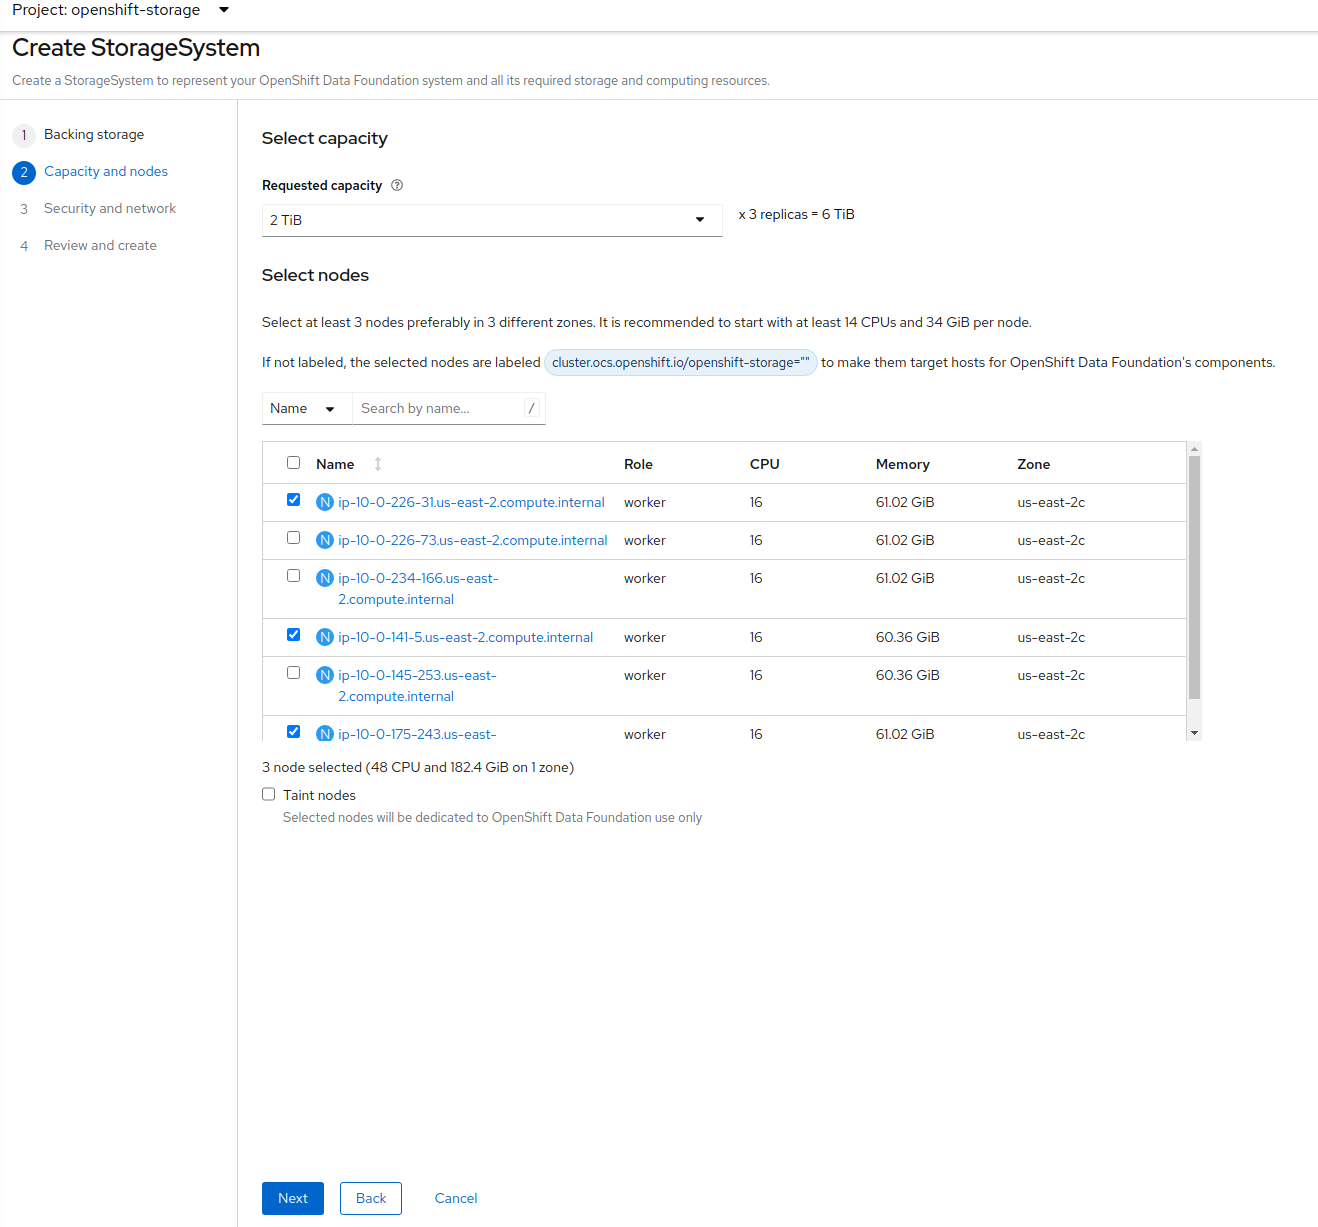
There should be 3 worker nodes already selected that had the OCS label applied in the last section. Execute command below and make sure they are all selected.
oc get nodes --show-labels | grep ocs | cut -d ' ' -f1Then click on the button Next below the dialog box with the 3 workers
selected with a checkmark. Click Next one more time until you see the figure below.
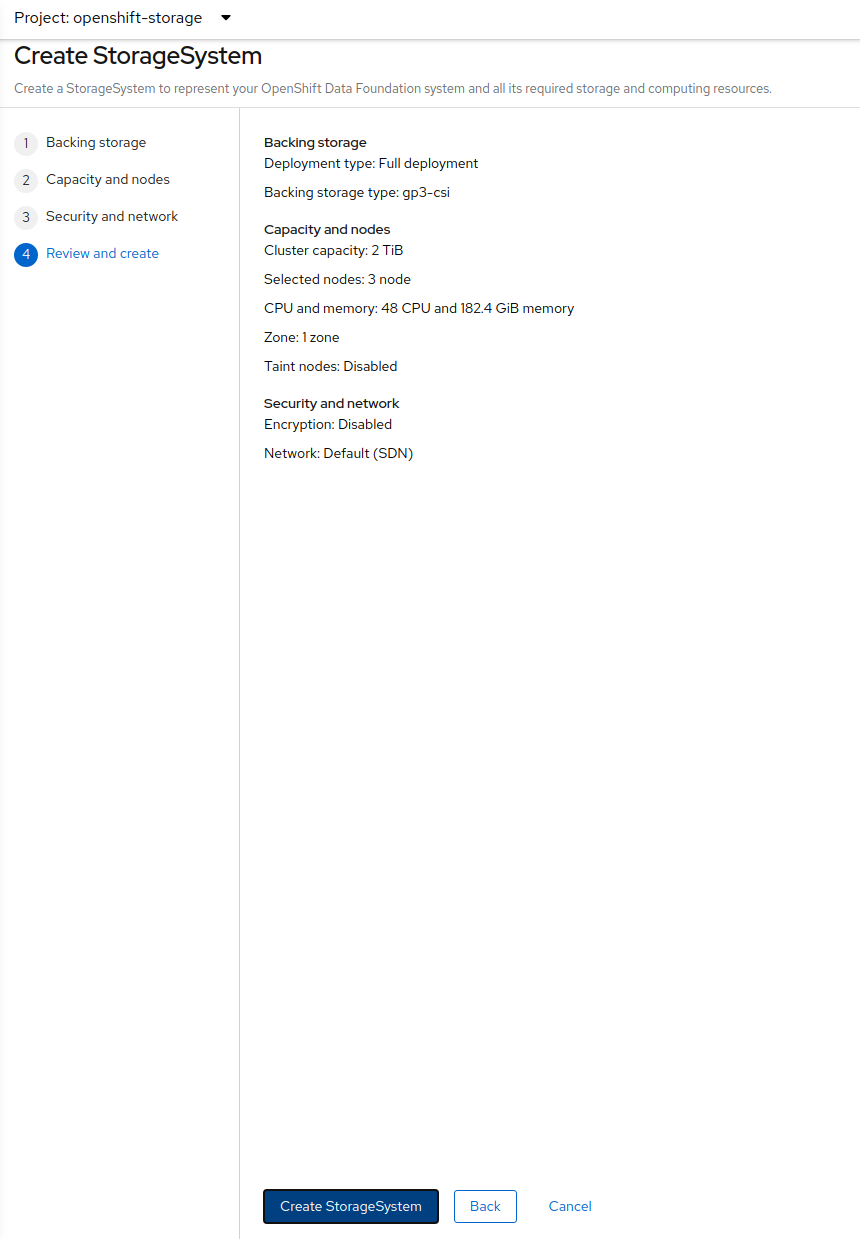
Click Create.
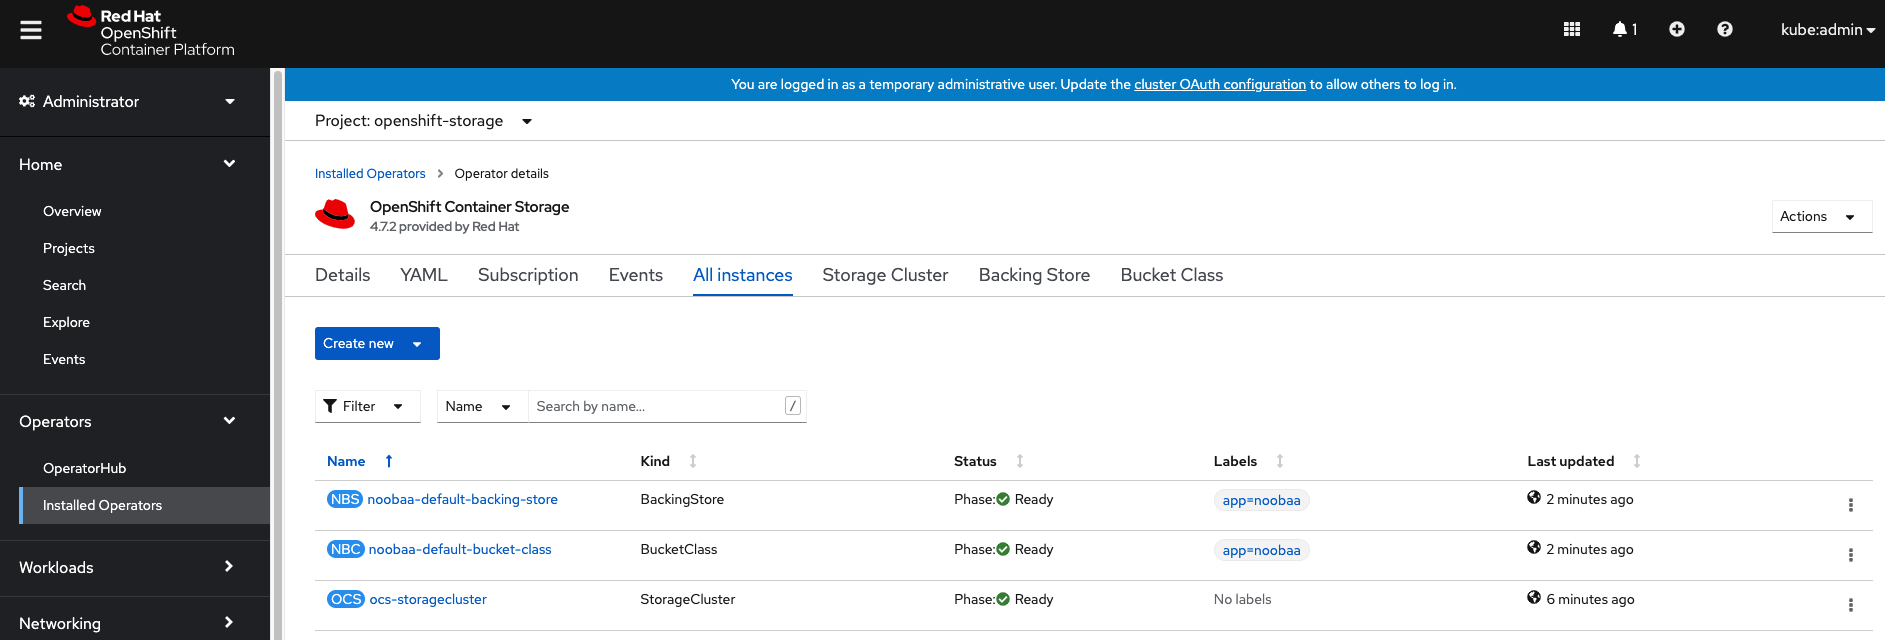
You can watch the deployment using the Openshift Web Console by going
back to the Openshift Container Storage Operator screen and selecting All
instances.
Please wait until all Pods are marked as Running in the CLI or until you
see all instances shown below as Ready Status in the Web Console as shown in the following diagram:
oc -n openshift-storage get podsNAME READY STATUS RESTART
S AGE
csi-cephfsplugin-875xd 3/3 Running 0
23m
csi-cephfsplugin-bncsj 3/3 Running 0
23m
csi-cephfsplugin-hjv77 3/3 Running 0
23m
csi-cephfsplugin-lch4m 3/3 Running 0
23m
csi-cephfsplugin-provisioner-6cfdc4bfbb-cklxs 6/6 Running 0
23m
csi-cephfsplugin-provisioner-6cfdc4bfbb-krkq5 6/6 Running 0
23m
csi-cephfsplugin-wtp4v 3/3 Running 0
23m
csi-rbdplugin-7clqf 3/3 Running 0
23m
csi-rbdplugin-8nllt 3/3 Running 0
23m
csi-rbdplugin-d267h 3/3 Running 0
23m
csi-rbdplugin-provisioner-b46dd5c7-vd58q 6/6 Running 0
23m
csi-rbdplugin-provisioner-b46dd5c7-z8mx6 6/6 Running 0
23m
csi-rbdplugin-tdj8f 3/3 Running 0
23m
csi-rbdplugin-wp65b 3/3 Running 0
23m
noobaa-core-0 1/1 Running 0
19m
noobaa-db-0 1/1 Running 0
19m
noobaa-endpoint-86cc5df669-ffqj2 1/1 Running 0
16m
noobaa-operator-698746cd47-sp6w9 1/1 Running 0
17h
ocs-metrics-exporter-78bc44687-pg4hk 1/1 Running 0
17h
ocs-operator-6d99bc6787-d7m9d 1/1 Running 0
17h
rook-ceph-crashcollector-ip-10-0-147-230-7cbf854757-chlgs 1/1 Running 0
20m
rook-ceph-crashcollector-ip-10-0-175-8-5779d5d5df-p6hkl 1/1 Running 0
21m
rook-ceph-crashcollector-ip-10-0-209-53-7ccc4cc785-wjxzd 1/1 Running 0
21m
rook-ceph-drain-canary-128c383c26627b938ab0fd7f47f58d33-665pbsg 1/1 Running 0
19m
rook-ceph-drain-canary-84c954eec459013180f78efd0a35792c-7b6qdnj 1/1 Running 0
19m
rook-ceph-drain-canary-ip-10-0-175-8.us-east-2.compute.intrh526 1/1 Running 0
19m
rook-ceph-mds-ocs-storagecluster-cephfilesystem-a-756df8b4kp9kr 1/1 Running 0
18m
rook-ceph-mds-ocs-storagecluster-cephfilesystem-b-64585764bbg6b 1/1 Running 0
18m
rook-ceph-mgr-a-5c74bb4b85-5x26g 1/1 Running 0
20m
rook-ceph-mon-a-746b5457c-hlh7n 1/1 Running 0
21m
rook-ceph-mon-b-754b99cfd-xs9g4 1/1 Running 0
21m
rook-ceph-mon-c-7474d96f55-qhhb6 1/1 Running 0
20m
rook-ceph-operator-59f7fb95d6-sdjd8 1/1 Running 0
17h
rook-ceph-osd-0-7d45696497-jwgb7 1/1 Running 0
19m
rook-ceph-osd-1-6f49b665c7-gxq75 1/1 Running 0
19m
rook-ceph-osd-2-76ffc64cd-9zg65 1/1 Running 0
19m
rook-ceph-osd-prepare-ocs-deviceset-gp2-0-data-0-9977n-49ngd 0/1 Completed 0
20m
rook-ceph-osd-prepare-ocs-deviceset-gp2-1-data-0-nnmpv-z8vq6 0/1 Completed 0
20m
rook-ceph-osd-prepare-ocs-deviceset-gp2-2-data-0-mtbtj-xrj2n 0/1 Completed 0
20mThe great thing about operators and OpenShift is that the operator has the
intelligence about the deployed components built-in. And, because of the
relationship between the CustomResource and the operator, you can check the
status by looking at the CustomResource itself. When you went therough the UI
dialogs, ultimately in the back-end an instance of a StorageCluster was
created:
oc get storagecluster -n openshift-storageYou can check the status of the storage cluster with the following:
oc get storagecluster -n openshift-storage ocs-storagecluster -o jsonpath='{.status.phase}{"\n"}'If it says Ready, you can continue.
2.3. Getting to know the Storage Dashboards
You can now also check the status of your storage cluster with the OCS specific
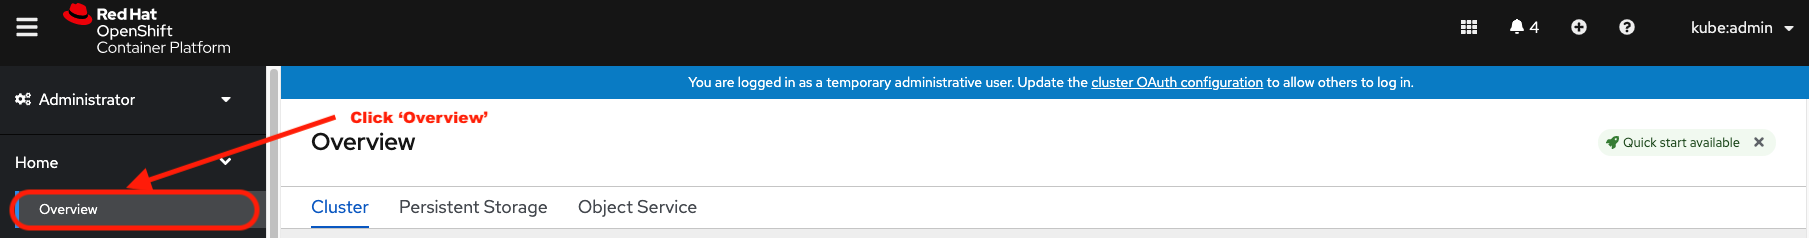
Dashboards that are included in your Openshift Web Console. You can reach
this by clicking on Overview on your left navigation bar, then selecting
Persistent Storage on the top navigation bar of the content page.
| If you just finished your OCS 4 deployment it could take 5-10 minutes for your Dashboards to fully populate. Different versions of OCP 4 may have minor differences in Dashboard sections and naming of Dashboards. |
1 |
Health |
Quick overview of the general health of the storage cluster |
2 |
Details |
Overview of the deployed storage cluster version and backend provider |
3 |
Inventory |
List of all the resources that are used and offered by the storage system |
4 |
Events |
Live overview of all the changes that are being done affecting the storage cluster |
5 |
Utilization |
Overview of the storage cluster usage and performance |
OCS ships with a Dashboard for the Object Store service as well. From the Overview click on the Object Service on the top
navigation bar of the content page.
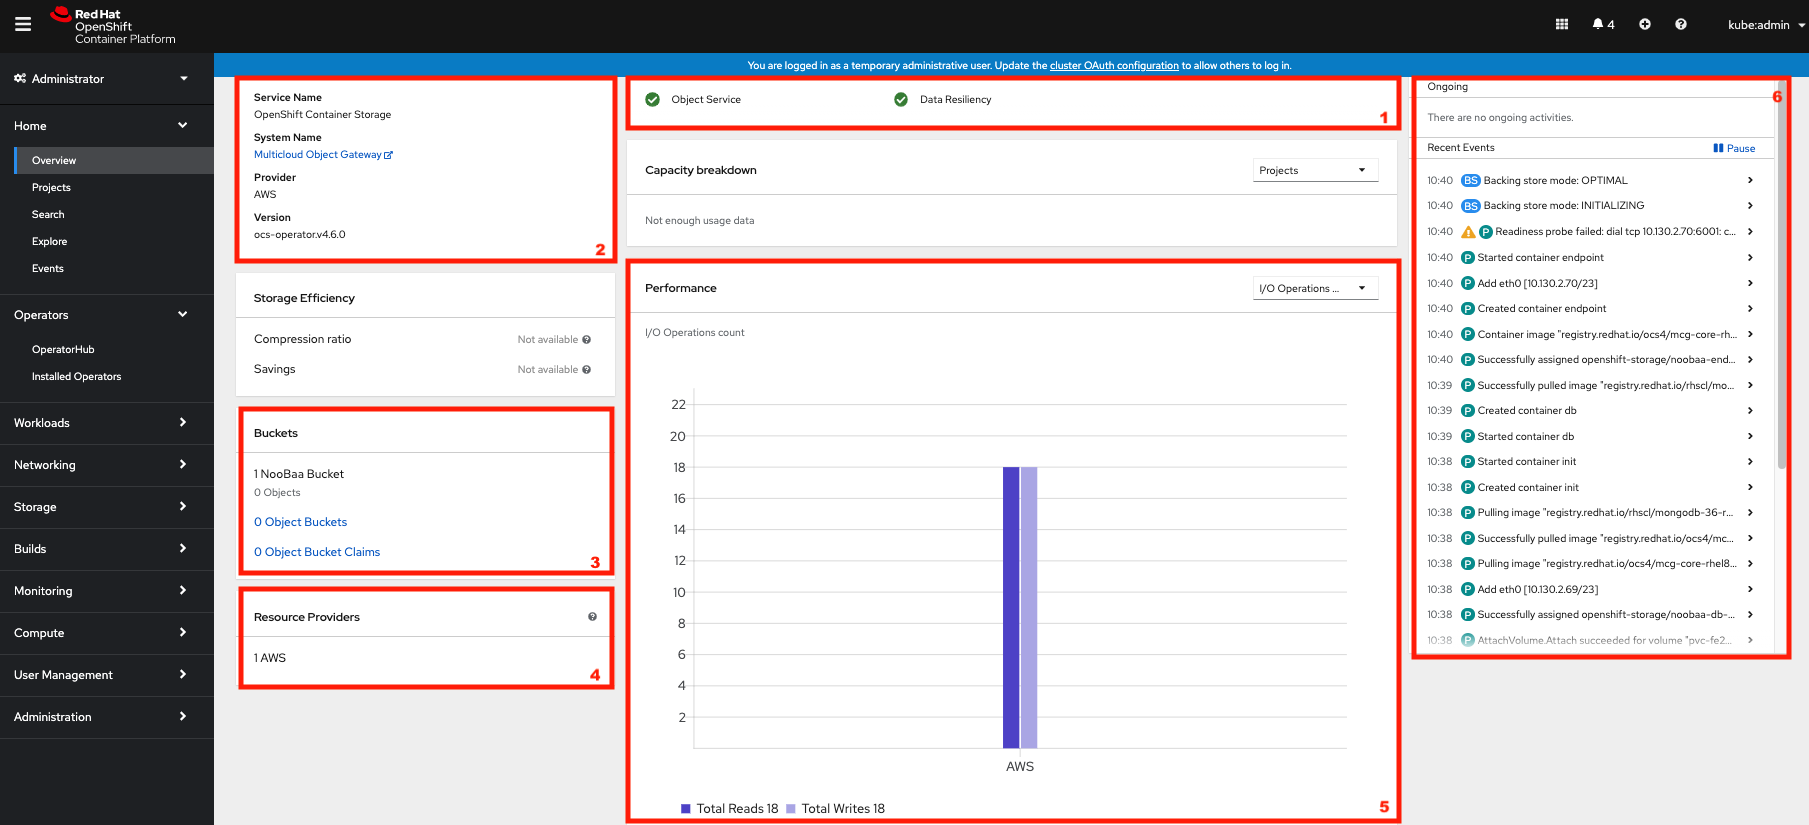
1 |
Health |
Quick overview of the general health of the Multi-Cloud-Gateway |
2 |
Details |
Overview of the deployed MCG version and backend provider including a link to the MCG Console |
3 |
Buckets |
List of all the ObjectBucket with are offered and ObjectBucketClaims which are connected to them |
4 |
Resource Providers |
Shows the list of configured Resource Providers that are available as backing storage in the MCG |
5 |
Counters |
Shows the current numbers of reads and writes issued against each provider |
6 |
Events |
Live overview of all the changes that are being done affecting the MCG |
Once this is all healthy, you will be able to use the three new StorageClasses created during the OCS 4 Install:
-
ocs-storagecluster-ceph-rbd
-
ocs-storagecluster-cephfs
-
openshift-storage.noobaa.io
You can see these three StorageClasses from the Openshift Web Console by
expanding the Storage menu in the left navigation bar and selecting
Storage Classes. You can also run the command below:
oc -n openshift-storage get scPlease make sure the three storage classes are available in your cluster before proceeding.
The NooBaa pod used the ocs-storagecluster-ceph-rbd storage class for
creating a PVC for mounting to the db container.
|
2.4. Using the Rook-Ceph toolbox to check on the Ceph backing storage
Since the Rook-Ceph toolbox is not shipped with OCS, we need to deploy it manually.
You can patch the OCSInitialization ocsinit using the following command line:
oc patch OCSInitialization ocsinit -n openshift-storage --type json --patch '[{ "op": "replace", "path": "/spec/enableCephTools", "value": true }]'After the rook-ceph-tools Pod is Running you can access the toolbox
like this:
TOOLS_POD=$(oc get pods -n openshift-storage -l app=rook-ceph-tools -o name)
oc rsh -n openshift-storage $TOOLS_POD
Once inside the toolbox, try out the following Ceph commands:
ceph statusceph osd statusceph osd treeceph dfrados dfceph versionssh-4.2# ceph status
cluster:
id: e3398039-f8c6-4937-ba9d-655f5c01e0ae
health: HEALTH_OK
services:
mon: 3 daemons, quorum a,b,c (age 6h)
mgr: a(active, since 6h)
mds: ocs-storagecluster-cephfilesystem:1 {0=ocs-storagecluster-cephfilesystem-a=up:active} 1 up:standby-replay
osd: 3 osds: 3 up (since 6h), 3 in (since 6h)
task status:
scrub status:
mds.ocs-storagecluster-cephfilesystem-a: idle
mds.ocs-storagecluster-cephfilesystem-b: idle
data:
pools: 3 pools, 96 pgs
objects: 120 objects, 245 MiB
usage: 3.5 GiB used, 6.0 TiB / 6 TiB avail
pgs: 96 active+clean
io:
client: 853 B/s rd, 16 KiB/s wr, 1 op/s rd, 1 op/s wrYou can exit the toolbox by either pressing Ctrl+D or by executing exit.
exit3. Create a new OCP application deployment using Ceph RBD volume
In this section the ocs-storagecluster-ceph-rbd StorageClass will be used
by an OCP application + database Deployment to create RWO (ReadWriteOnce)
persistent storage. The persistent storage will be a Ceph RBD (RADOS Block
Device) volume in the Ceph pool ocs-storagecluster-cephblockpool.
To do so we have created a template file, based on the OpenShift
rails-pgsql-persistent template, that includes an extra parameter STORAGE_CLASS
that enables the end user to specify the StorageClass the PVC should use.
Feel free to download
https://github.com/red-hat-storage/ocs-training/blob/master/training/modules/ocs4/attachments/configurable-rails-app.yaml to check on the format of this
template. Search for STORAGE_CLASS in the downloaded content.
Make sure that you completed all previous sections so that you are ready to start the Rails + PostgreSQL Deployment.
Start by creating a new project:
oc new-project my-database-appThen use the rails-pgsql-persistent template to create the new application.
curl -s https://raw.githubusercontent.com/red-hat-storage/ocs-training/master/training/modules/ocs4/attachments/configurable-rails-app.yaml | oc new-app -p STORAGE_CLASS=ocs-storagecluster-ceph-rbd -p VOLUME_CAPACITY=5Gi -f -After the deployment is started you can monitor with these commands.
oc statusCheck the PVC is created.
oc get pvc -n my-database-appThis step could take 5 or more minutes. Wait until there are 2 Pods in
Running STATUS and 4 Pods in Completed STATUS as shown below.
watch oc get pods -n my-database-appNAME READY STATUS RESTARTS AGE
postgresql-1-deploy 0/1 Completed 0 5m48s
postgresql-1-lf7qt 1/1 Running 0 5m40s
rails-pgsql-persistent-1-build 0/1 Completed 0 5m49s
rails-pgsql-persistent-1-deploy 0/1 Completed 0 3m36s
rails-pgsql-persistent-1-hook-pre 0/1 Completed 0 3m28s
rails-pgsql-persistent-1-pjh6q 1/1 Running 0 3m14sYou can exit by pressing Ctrl+C.
Once the deployment is complete you can now test the application and the persistent storage on Ceph.
oc get route rails-pgsql-persistent -n my-database-app -o jsonpath --template="http://{.spec.host}/articles{'\n'}"This will return a route similar to this one.
http://rails-pgsql-persistent-my-database-app.apps.cluster-ocs4-8613.ocs4-8613.sandbox944.opentlc.com/articlesCopy your route (different than above) to a browser window to create articles.
Enter the username and password below to create articles and comments.
The articles and comments are saved in a PostgreSQL database which stores its
table spaces on the Ceph RBD volume provisioned using the
ocs-storagecluster-ceph-rbd StorageClass during the application
deployment.
username: openshift
password: secret
Lets now take another look at the Ceph ocs-storagecluster-cephblockpool
created by the ocs-storagecluster-ceph-rbd StorageClass. Log into the
toolbox pod again.
TOOLS_POD=$(oc get pods -n openshift-storage -l app=rook-ceph-tools -o name)
oc rsh -n openshift-storage $TOOLS_POD
Run the same Ceph commands as before the application deployment and compare
to results in prior section. Notice the number of objects in
ocs-storagecluster-cephblockpool has increased. The third command lists
RBD volumes and we should now have two RBDs.
ceph dfrados dfrbd -p ocs-storagecluster-cephblockpool ls | grep volYou can exit the toolbox by either pressing Ctrl+D or by executing exit.
exit3.1. Matching PVs to RBDs
A handy way to match OCP persistent volumes (PVs)to Ceph RBDs is to execute:
oc get pv -o 'custom-columns=NAME:.spec.claimRef.name,PVNAME:.metadata.name,STORAGECLASS:.spec.storageClassName,VOLUMEHANDLE:.spec.csi.volumeHandle'NAME PVNAME STORAGECLASS VOLUMEHANDLE
ocs-deviceset-0-0-d2ppm pvc-2c08bd9c-332d-11ea-a32f-061f7a67362c gp2 <none>
ocs-deviceset-1-0-9tmc6 pvc-2c0a0ed5-332d-11ea-a32f-061f7a67362c gp2 <none>
ocs-deviceset-2-0-qtbfv pvc-2c0babb3-332d-11ea-a32f-061f7a67362c gp2 <none>
db-noobaa-core-0 pvc-4610a3ce-332d-11ea-a32f-061f7a67362c ocs-storagecluster-ceph-rbd 0001-0011-openshift-storage-0000000000000001-4a74e248-332d-11ea-9a7c-0a580a820205
postgresql pvc-874f93cb-3330-11ea-90b1-0a10d22e734a ocs-storagecluster-ceph-rbd 0001-0011-openshift-storage-0000000000000001-8765a21d-3330-11ea-9a7c-0a580a820205
rook-ceph-mon-a pvc-d462ecb0-332c-11ea-a32f-061f7a67362c gp2 <none>
rook-ceph-mon-b pvc-d79d0db4-332c-11ea-a32f-061f7a67362c gp2 <none>
rook-ceph-mon-c pvc-da9cc0e3-332c-11ea-a32f-061f7a67362c gp2 <none>The second half of the VOLUMEHANDLE column mostly matches what your RBD is
named inside of Ceph. All you have to do is append csi-vol- to the front
like this:
CSIVOL=$(oc get pv $(oc get pv | grep my-database-app | awk '{ print $1 }') -o jsonpath='{.spec.csi.volumeHandle}' | cut -d '-' -f 6- | awk '{print "csi-vol-"$1}')
echo $CSIVOLcsi-vol-8765a21d-3330-11ea-9a7c-0a580a820205TOOLS_POD=$(oc get pods -n openshift-storage -l app=rook-ceph-tools -o name)
oc rsh -n openshift-storage $TOOLS_POD rbd -p ocs-storagecluster-cephblockpool info $CSIVOLrbd image 'csi-vol-8765a21d-3330-11ea-9a7c-0a580a820205':
size 5 GiB in 1280 objects
order 22 (4 MiB objects)
snapshot_count: 0
id: 17e811c7f287
block_name_prefix: rbd_data.17e811c7f287
format: 2
features: layering
op_features:
flags:
create_timestamp: Thu Jan 9 22:36:51 2020
access_timestamp: Thu Jan 9 22:36:51 2020
modify_timestamp: Thu Jan 9 22:36:51 20203.2. Expand RBD based PVCs
OpenShift 4.5 and later versions let you expand an existing PVC based on the
ocs-storagecluster-ceph-rbd StorageClass. This section walks you through
the steps to perform a PVC expansion.
We will first artificially fill up the PVC used by the application you have just created.
oc rsh -n my-database-app $(oc get pods -n my-database-app|grep postgresql | grep -v deploy | awk {'print $1}')dfFilesystem 1K-blocks Used Available Use% Mounted on
overlay 125277164 12004092 113273072 10% /
tmpfs 65536 0 65536 0% /dev
tmpfs 32571336 0 32571336 0% /sys/fs/cgroup
shm 65536 8 65528 1% /dev/shm
tmpfs 32571336 10444 32560892 1% /etc/passwd
/dev/mapper/coreos-luks-root-nocrypt 125277164 12004092 113273072 10% /etc/hosts
/dev/rbd1 5095040 66968 5011688 2% /var/lib/pgsql/data
tmpfs 32571336 28 32571308 1% /run/secrets/kubernetes.io/serviceaccount
tmpfs 32571336 0 32571336 0% /proc/acpi
tmpfs 32571336 0 32571336 0% /proc/scsi
tmpfs 32571336 0 32571336 0% /sys/firmwareAs observed in the output above the device named /dev/rbd1
is mounted as /var/lib/pgsql/data. This is the directory we will artificially
fill up.
dd if=/dev/zero of=/var/lib/pgsql/data/fill.up bs=1M count=38503850+0 records in
3850+0 records out
4037017600 bytes (4.0 GB) copied, 13.6446 s, 296 MB/sLet’s verify the volume mounted has increased.
dfFilesystem 1K-blocks Used Available Use% Mounted on
overlay 125277164 12028616 113248548 10% /
tmpfs 65536 0 65536 0% /dev
tmpfs 32571336 0 32571336 0% /sys/fs/cgroup
shm 65536 8 65528 1% /dev/shm
tmpfs 32571336 10444 32560892 1% /etc/passwd
/dev/mapper/coreos-luks-root-nocrypt 125277164 12028616 113248548 10% /etc/hosts
/dev/rbd1 5095040 4009372 1069284 79% /var/lib/pgsql/data
tmpfs 32571336 28 32571308 1% /run/secrets/kubernetes.io/serviceaccount
tmpfs 32571336 0 32571336 0% /proc/acpi
tmpfs 32571336 0 32571336 0% /proc/scsi
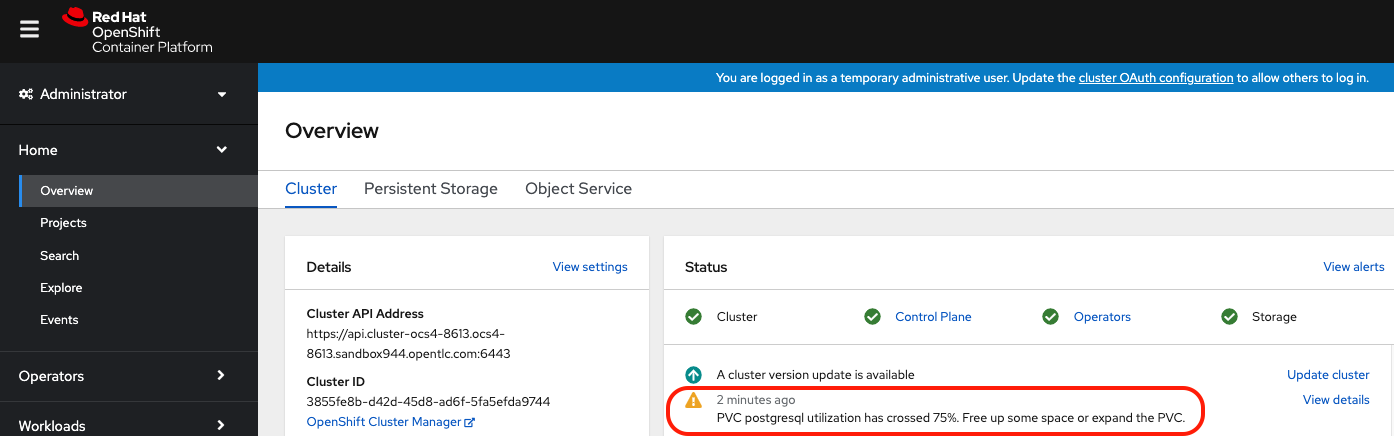
tmpfs 32571336 0 32571336 0% /sys/firmwareAs observed in the output above, the filesystem usage for /var/lib/pgsql/data
has increased up to 79%. By default OCP will generate a PVC alert when a PVC
crosses the 75% full threshold.
Now exit the pod.
exitLet’s verify an alert has appeared in the OCP event log.
3.2.1. Expand applying a modified PVC YAML file
To expand a PVC we simply need to change the actual amount of storage that is requested. This can easily be performed by exporting the PVC specifications into a YAML file with the following command:
oc get pvc postgresql -n my-database-app -o yaml > pvc.yamlIn the file pvc.yaml that was created, search for the following section using
your favorite editor.
[truncated]
spec:
  accessModes:
  - ReadWriteOnce
  resources:
    requests:
      storage: 5Gi
  storageClassName: ocs-storagecluster-ceph-rbd
  volumeMode: Filesystem
  volumeName: pvc-4d6838df-b4cd-4bb1-9969-1af93c1dc5e6
status: {}
Edit storage: 5Gi and replace it with storage: 10Gi. The resulting section
in your file should look like the output below.
[truncated]
spec:
  accessModes:
  - ReadWriteOnce
  resources:
    requests:
      storage: 10Gi
  storageClassName: ocs-storagecluster-ceph-rbd
  volumeMode: Filesystem
  volumeName: pvc-4d6838df-b4cd-4bb1-9969-1af93c1dc5e6
status: {}
Now you can apply your updated PVC specifications using the following command:
oc apply -f pvc.yaml -n my-database-appWarning: oc apply should be used on resource created by either oc create
--save-config or oc apply persistentvolumeclaim/postgresql configuredYou can visualize the progress of the expansion of the PVC using the following command:
oc describe pvc postgresql -n my-database-app[truncated]
Finalizers: [kubernetes.io/pvc-protection]
Capacity: 10Gi
Access Modes: RWO
VolumeMode: Filesystem
Mounted By: postgresql-1-p62vw
Events:
Type Reason Age From Message
---- ------ ---- ---- -------
Normal ExternalProvisioning 120m persistentvolume-controller waiting for a volume to be created, either by external provisioner "openshift-storage.rbd.csi.ceph.com" or manually created by system administrator
Normal Provisioning 120m openshift-storage.rbd.csi.ceph.com_csi-rbdplugin-provisioner-66f66699c8-gcm7t_3ce4b8bc-0894-4824-b23e-ed9bd46e7b41 External provisioner is provisioning volume for claim "my-database-app/postgresql"
Normal ProvisioningSucceeded 120m openshift-storage.rbd.csi.ceph.com_csi-rbdplugin-provisioner-66f66699c8-gcm7t_3ce4b8bc-0894-4824-b23e-ed9bd46e7b41 Successfully provisioned volume pvc-4d6838df-b4cd-4bb1-9969-1af93c1dc5e6
Warning ExternalExpanding 65s volume_expand Ignoring the PVC: didn't find a plugin capable of expanding the volume; waiting for an external controller to process this PVC.
Normal Resizing 65s external-resizer openshift-storage.rbd.csi.ceph.com External resizer is resizing volume pvc-4d6838df-b4cd-4bb1-9969-1af93c1dc5e6
Normal FileSystemResizeRequired 65s external-resizer openshift-storage.rbd.csi.ceph.com Require file system resize of volume on node
Normal FileSystemResizeSuccessful 23s kubelet, ip-10-0-199-224.us-east-2.compute.internal MountVolume.NodeExpandVolume succeeded for volume "pvc-4d6838df-b4cd-4bb1-9969-1af93c1dc5e6"| The expansion process commonly takes over 30 seconds to complete and is based on the workload of your pod. This is due to the fact that the expansion requires the resizing of the underlying RBD image (pretty fast) while also requiring the resize of the filesystem that sits on top of the block device. To perform the latter the filesystem must be quiesced to be safely expanded. |
| Reducing the size of a PVC is NOT supported. |
Another way to check on the expansion of the PVC is to simply display the PVC information using the following command:
oc get pvc -n my-database-appNAME STATUS VOLUME CAPACITY ACCESS MODES STORAGECLASS AGE
postgresql Bound pvc-4d6838df-b4cd-4bb1-9969-1af93c1dc5e6 10Gi RWO ocs-storagecluster-ceph-rbd 121m
The CAPACITY column will reflect the new requested size when the
expansion process is complete.
|
Another method to check on the expansion of the PVC is to go through two specific fields of the PVC object via the CLI.
The current allocated size for the PVC can be checked this way:
echo $(oc get pvc postgresql -n my-database-app -o jsonpath='{.status.capacity.storage}')10GiThe requested size for the PVC can be checked this way:
echo $(oc get pvc postgresql -n my-database-app -o jsonpath='{.spec.resources.requests.storage}')10Gi| When both results report the same value, the expansion was successful. |
3.2.2. Expand via the User Interface
The last method available to expand a PVC is to do so through the OpenShift Web Console. Proceed as follow:
First step is to select the project to which the PVC belongs to.
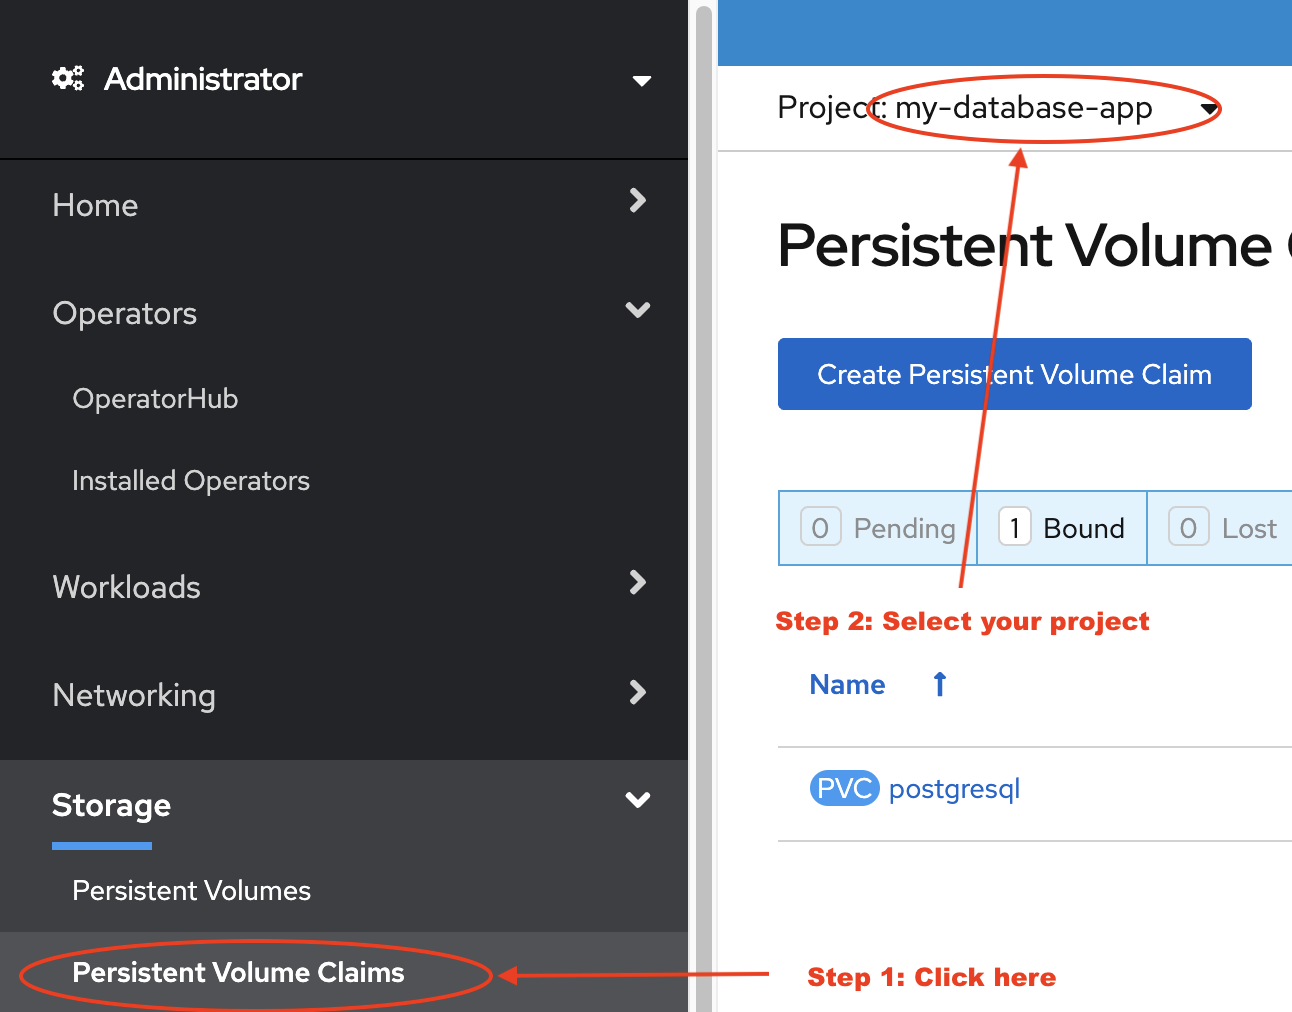
Choose Expand PVC from the contextual menu.
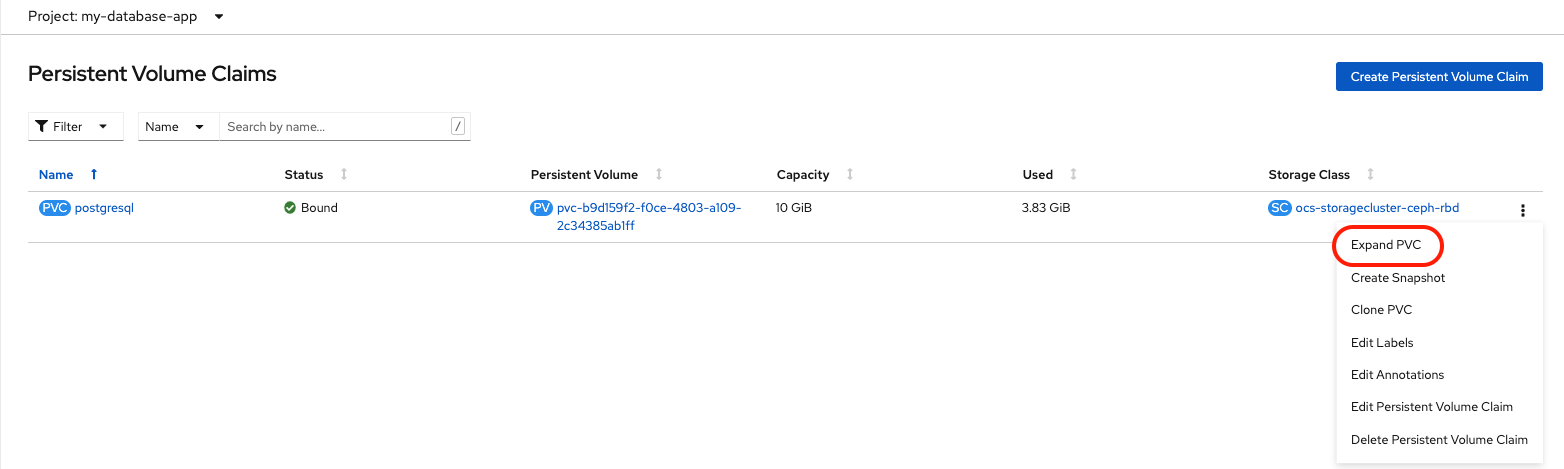
In the dialog box that appears enter the new capacity for the PVC.
| You can NOT reduce the size of a PVC. |
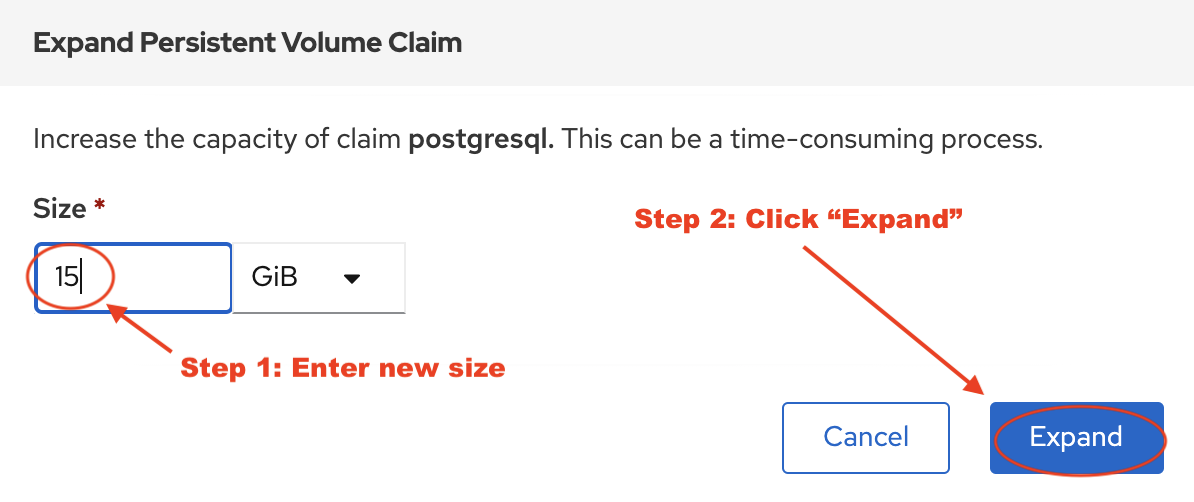
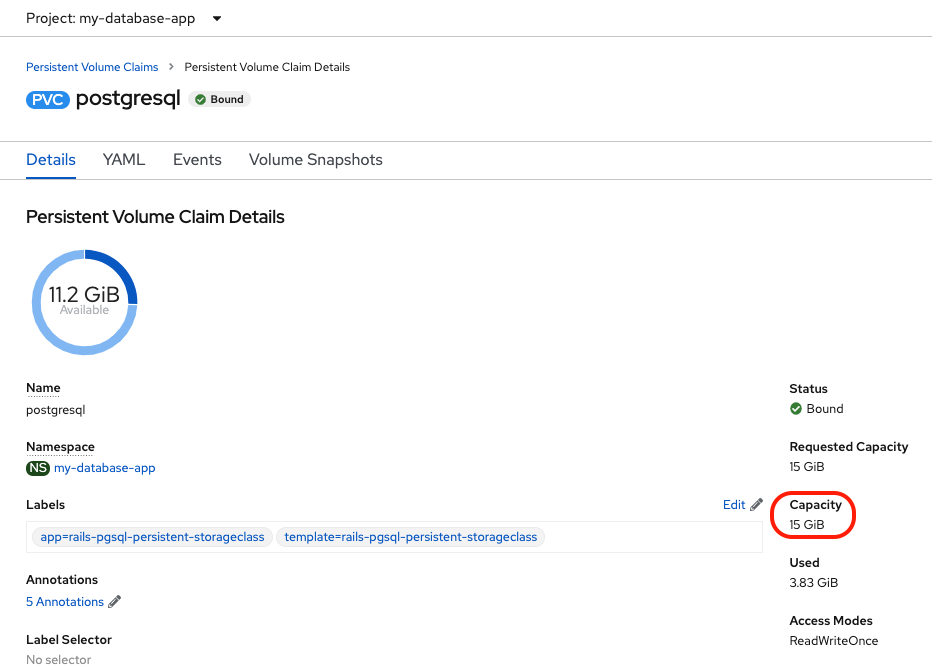
You now simply have to wait for the expansion to complete and for the new size to be reflected in the console (15 GiB).
4. Create a new OCP application deployment using CephFS volume
In this section the ocs-storagecluster-cephfs StorageClass will be used to
create a RWX (ReadWriteMany) PVC that can be used by multiple pods at the
same time. The application we will use is called File Uploader.
Create a new project:
oc new-project my-shared-storageNext deploy the example PHP application called file-uploader:
oc new-app openshift/php:7.2-ubi8~https://github.com/christianh814/openshift-php-upload-demo --name=file-uploader--> Found image 4f2dcc0 (9 days old) in image stream "openshift/php" under tag "7.2-ubi8" for "openshift/php:7.2-
ubi8"
Apache 2.4 with PHP 7.2
-----------------------
PHP 7.2 available as container is a base platform for building and running various PHP 7.2 applications and f
rameworks. PHP is an HTML-embedded scripting language. PHP attempts to make it easy for developers to write dynam
ically generated web pages. PHP also offers built-in database integration for several commercial and non-commerci
al database management systems, so writing a database-enabled webpage with PHP is fairly simple. The most common
use of PHP coding is probably as a replacement for CGI scripts.
Tags: builder, php, php72, php-72
* A source build using source code from https://github.com/christianh814/openshift-php-upload-demo will be cr
eated
* The resulting image will be pushed to image stream tag "file-uploader:latest"
* Use 'oc start-build' to trigger a new build
--> Creating resources ...
imagestream.image.openshift.io "file-uploader" created
buildconfig.build.openshift.io "file-uploader" created
deployment.apps "file-uploader" created
service "file-uploader" created
--> Success
Build scheduled, use 'oc logs -f buildconfig/file-uploader' to track its progress.
Application is not exposed. You can expose services to the outside world by executing one or more of the comm
ands below:
'oc expose service/file-uploader'
Run 'oc status' to view your app.Watch the build log and wait for the application to be deployed:
oc logs -f bc/file-uploader -n my-shared-storageCloning "https://github.com/christianh814/openshift-php-upload-demo" ...
[...]
Generating dockerfile with builder image image-registry.openshift-image-regis
try.svc:5000/openshift/php@sha256:d97466f33999951739a76bce922ab17088885db610c
0e05b593844b41d5494ea
STEP 1: FROM image-registry.openshift-image-registry.svc:5000/openshift/php@s
ha256:d97466f33999951739a76bce922ab17088885db610c0e05b593844b41d5494ea
STEP 2: LABEL "io.openshift.build.commit.author"="Christian Hernandez <christ
ian.hernandez@yahoo.com>" "io.openshift.build.commit.date"="Sun Oct 1 1
7:15:09 2017 -0700" "io.openshift.build.commit.id"="288eda3dff43b02f7f7
b6b6b6f93396ffdf34cb2" "io.openshift.build.commit.ref"="master" "
io.openshift.build.commit.message"="trying to modularize" "io.openshift
.build.source-location"="https://github.com/christianh814/openshift-php-uploa
d-demo" "io.openshift.build.image"="image-registry.openshift-image-regi
stry.svc:5000/openshift/php@sha256:d97466f33999951739a76bce922ab17088885db610
c0e05b593844b41d5494ea"
STEP 3: ENV OPENSHIFT_BUILD_NAME="file-uploader-1" OPENSHIFT_BUILD_NAMESP
ACE="my-shared-storage" OPENSHIFT_BUILD_SOURCE="https://github.com/christ
ianh814/openshift-php-upload-demo" OPENSHIFT_BUILD_COMMIT="288eda3dff43b0
2f7f7b6b6b6f93396ffdf34cb2"
STEP 4: USER root
STEP 5: COPY upload/src /tmp/src
STEP 6: RUN chown -R 1001:0 /tmp/src
STEP 7: USER 1001
STEP 8: RUN /usr/libexec/s2i/assemble
---> Installing application source...
=> sourcing 20-copy-config.sh ...
---> 17:24:39 Processing additional arbitrary httpd configuration provide
d by s2i ...
=> sourcing 00-documentroot.conf ...
=> sourcing 50-mpm-tuning.conf ...
=> sourcing 40-ssl-certs.sh ...
STEP 9: CMD /usr/libexec/s2i/run
STEP 10: COMMIT temp.builder.openshift.io/my-shared-storage/file-uploader-1:3
b83e447
Getting image source signatures
[...]
Writing manifest to image destination
Storing signatures
Successfully pushed image-registry.openshift-image-registry.svc:5000/my-share
d-storage/file-uploader@sha256:929c0ce3dcc65a6f6e8bd44069862858db651358b88065
fb483d51f5d704e501
Push successfulThe command prompt returns out of the tail mode once you see Push successful.
This use of the new-app command directly asked for application code to
be built and did not involve a template. That is why it only created a single
Pod deployment with a Service and no Route.
|
Let’s make our application production ready by exposing it via a Route and
scale to 3 instances for high availability:
oc expose svc/file-uploader -n my-shared-storageoc scale --replicas=3 deploy/file-uploader -n my-shared-storageoc get pods -n my-shared-storageYou should have 3 file-uploader Pods in a few minutes. Repeat the command above
until there are 3 file-uploader Pods in Running STATUS.
|
Never attempt to store persistent data in a Pod that has no persistent volume associated with it. Pods and their containers are ephemeral by definition, and any stored data will be lost as soon as the Pod terminates for whatever reason. |
We can fix this by providing shared persistent storage to this application.
You can create a PersistentVolumeClaim and attach it into an application with
the oc set volume command. Execute the following
oc set volume deploy/file-uploader --add --name=my-shared-storage \
-t pvc --claim-mode=ReadWriteMany --claim-size=1Gi \
--claim-name=my-shared-storage --claim-class=ocs-storagecluster-cephfs \
--mount-path=/opt/app-root/src/uploaded \
-n my-shared-storage
This command will:
-
create a PersistentVolumeClaim
-
update the Deployment to include a
volumedefinition -
update the Deployment to attach a
volumemountinto the specifiedmount-path -
cause a new deployment of the 3 application Pods
For more information on what oc set volume is capable of, look at its help
output with oc set volume -h. Now, let’s look at the result of adding the
volume:
oc get pvc -n my-shared-storageNAME STATUS VOLUME CAPACITY ACCESS MODES STORAGECLASS AGE
my-shared-storage Bound pvc-c34bb9db-43a7-4eca-bc94-0251d7128721 1Gi RWX ocs-storagecluster-cephfs 47sNotice the ACCESSMODE being set to RWX (short for ReadWriteMany).
All 3 file-uploaderPods are using the same RWX volume. Without this
ACCESSMODE, OpenShift will not attempt to attach multiple Pods to the
same PersistentVolume reliably. If you attempt to scale up deployments that
are using RWO or ReadWriteOnce storage, the Pods will actually all
become co-located on the same node.
Now let’s use the file uploader web application using your browser to upload new files.
First, find the Route that has been created:
oc get route file-uploader -n my-shared-storage -o jsonpath --template="http://{.spec.host}{'\n'}"This will return a route similar to this one.
http://file-uploader-my-shared-storage.apps.cluster-ocs4-abdf.ocs4-abdf.sandbox744.opentlc.comPoint your browser to the web application using your route above. Your route
will be different.
The web app simply lists all uploaded files and offers the ability to upload new ones as well as download the existing data. Right now there is nothing.
Select an arbitrary file from your local machine and upload it to the app.
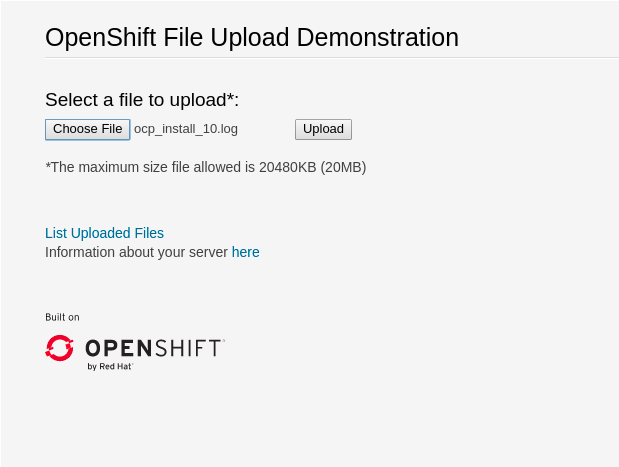
Once done click List uploaded files to see the list of all currently uploaded files.
4.1. Expand CephFS based PVCs
OpenShift 4.5 and later versions let you expand an existing PVC based on the
ocs-storagecluster-cephfs StorageClass. This chapter walks you through the
steps to perform a PVC expansion through the CLI.
| All the other methods described for expanding a Ceph RBD based PVC are also available. |
The my-sharged-storage PVC size is currently 1Gi. Let’s increase the size to 5Gi using the oc patch command.
oc patch pvc my-shared-storage -n my-shared-storage --type json --patch '[{ "op": "replace", "path": "/spec/resources/requests/storage", "value": "5Gi" }]'persistentvolumeclaim/my-shared-storage patchedNow let’s verify the RWX PVC has been expanded.
echo $(oc get pvc my-shared-storage -n my-shared-storage -o jsonpath='{.spec.resources.requests.storage}')5Giecho $(oc get pvc my-shared-storage -n my-shared-storage -o jsonpath='{.status.capacity.storage}')5GiRepeat both commands until output values are identical.
| CephFS based RWX PVC resizing, as opposed to RBD based PVCs, is almost instantaneous. This is due to the fact that resizing such PVC does not involved resizing a filesystem but simply involves updating a quota for the mounted filesystem. |
| Reducing the size of a CephFS PVC is NOT supported. |
5. PVC Clone and Snapshot
Starting with version OCS version 4.6, the Container Storage Interface (CSI) features of being able to clone or snapshot a persistent volume are now supported. These new capabilities are very important for protecting persistent data and can be used with third party Backup and Restore vendors that have CSI integration.
In addition to third party backup and restore vendors, OCS snapshot for Ceph RBD and CephFS PVCs can be triggered using OpenShift APIs for Data Protection (OADP) which is an un-supported community operator in OperatorHub that can be very useful for testing backup and restore of persistent data including OpenShift metadata (definition files for pods, service, routes, deployments, etc.).
5.1. PVC Clone
A CSI volume clone is a duplicate of an existing persistent volume at a particular point in time. Cloning creates an exact duplicate of the specified volume in OCS. After dynamic provisioning, you can use a volume clone just as you would use any standard volume.
5.1.1. Provisioning a CSI Volume clone
For this exercise we will use the already created PVC postgresql that was just expanded to 15 GiB. Make sure you have done section Create a new OCP application deployment using Ceph RBD volume before proceeding.
oc get pvc -n my-database-app | awk {'print $1}'NAME
postgresql
Make sure you expanded the postgresql PVC to 15Gi before proceeding. If not expanded go back and complete this section Expand RBD based PVCs.
|
Before creating the PVC clone make sure to create and save at least one new article so there is new data in the postgresql PVC.
oc get route rails-pgsql-persistent -n my-database-app -o jsonpath --template="http://{.spec.host}/articles{'\n'}"This will return a route similar to this one.
http://rails-pgsql-persistent-my-database-app.apps.cluster-ocs4-8613.ocs4-8613.sandbox944.opentlc.com/articlesCopy your route (different than above) to a browser window to create articles.
Enter the username and password below to create a new article.
username: openshift
password: secret
To protect the data (articles) in this PVC we will now clone this PVC. The operation of creating a clone can be done using the OpenShift Web Console or by creating the resource via a YAML file.
apiVersion: v1
kind: PersistentVolumeClaim
metadata:
  name: postgresql-clone
  namespace: my-database-app
spec:
  storageClassName: ocs-storagecluster-ceph-rbd
  accessModes:
    - ReadWriteOnce
  resources:
    requests:
      storage: 15Gi
  dataSource:
    kind: PersistentVolumeClaim
    name: postgresql
Doing the same operation in the OpenShift Web Console would require navigating to Storage → Persistent Volume Claim and choosing Clone PVC.
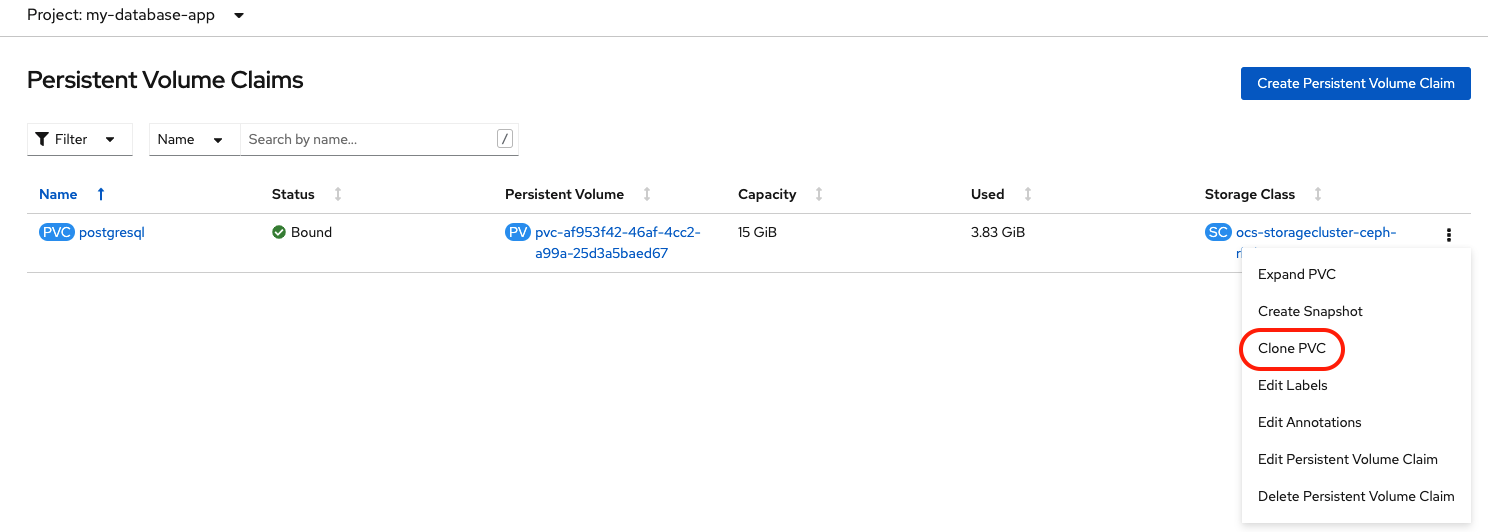
Size of new clone PVC is greyed out. The new PVC will be the same size as the original.
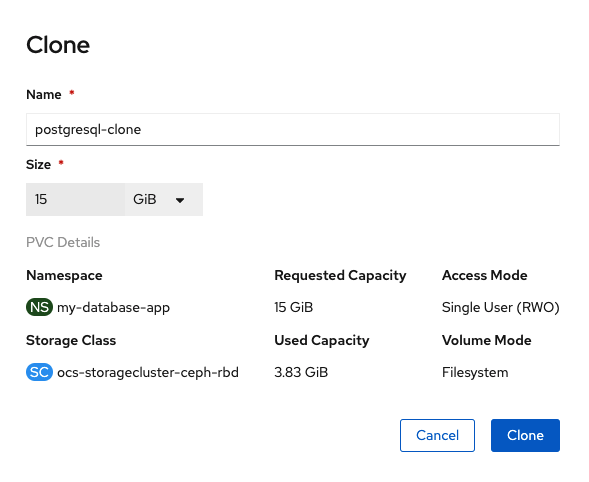
Now create a PVC clone for postgresql.
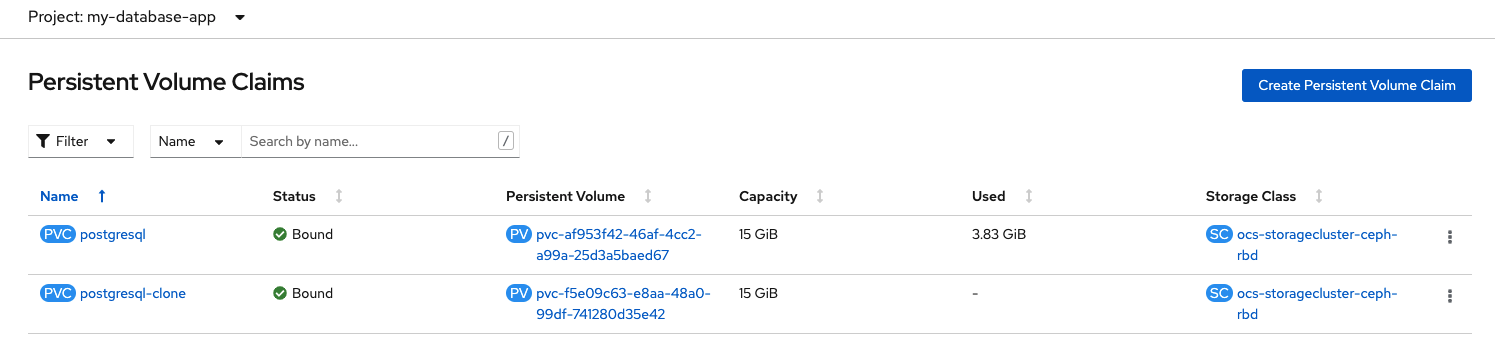
curl -s https://raw.githubusercontent.com/red-hat-storage/ocs-training/master/training/modules/ocs4/attachments/postgresql-clone.yaml | oc apply -f -persistentvolumeclaim/postgresql-clone createdNow check to see there is a new PVC.
oc get pvc -n my-database-app | grep clonepostgresql-clone Bound pvc-f5e09c63-e8aa-48a0-99df-741280d35e42 15Gi RWO ocs-storagecluster-ceph-rbd 3m47sYou can also check the new clone PVC in the OpenShift Web Console.
5.1.2. Using a CSI Volume clone for application recovery
Now that you have a clone for postgresql PVC you are ready to test by corrupting the database.
The following command will print all postgresql tables before deleting the article tables in the database and after the tables are deleted.
oc rsh -n my-database-app $(oc get pods -n my-database-app|grep postgresql | grep -v deploy | awk {'print $1}') psql -c "\c root" -c "\d+" -c "drop table articles cascade;" -c "\d+"You are now connected to database "root" as user "postgres".
List of relations
Schema | Name | Type | Owner | Size | Description
--------+----------------------+----------+---------+------------+-------------
public | ar_internal_metadata | table | userXNL | 16 kB |
public | articles | table | userXNL | 16 kB |
public | articles_id_seq | sequence | userXNL | 8192 bytes |
public | comments | table | userXNL | 8192 bytes |
public | comments_id_seq | sequence | userXNL | 8192 bytes |
public | schema_migrations | table | userXNL | 16 kB |
(6 rows)
NOTICE: drop cascades to constraint fk_rails_3bf61a60d3 on table comments
DROP TABLE
List of relations
Schema | Name | Type | Owner | Size | Description
--------+----------------------+----------+---------+------------+-------------
public | ar_internal_metadata | table | userXNL | 16 kB |
public | comments | table | userXNL | 8192 bytes |
public | comments_id_seq | sequence | userXNL | 8192 bytes |
public | schema_migrations | table | userXNL | 16 kB |
(4 rows)Now go back to the browser tab where you created your article using this link:
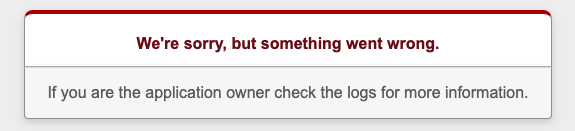
oc get route rails-pgsql-persistent -n my-database-app -o jsonpath --template="http://{.spec.host}/articles{'\n'}"If you refresh the browser you will see the application has failed.
Remember a PVC clone is an exact duplica of the original PVC at the time the clone was created. Therefore you can use you postgresql clone to recover the application.
First you need to scale the rails-pgsql-persistent deployment down to zero so the Pod will be deleted.
oc scale deploymentconfig rails-pgsql-persistent -n my-database-app --replicas=0deploymentconfig.apps.openshift.io/rails-pgsql-persistent scaledVerify the Pod is gone.
oc get pods -n my-database-app | grep rails | egrep -v 'deploy|build|hook' | awk {'print $1}'Wait until there is no result for this command. Repeat if necessary.
Now you need to patch the deployment for postgesql and modify to use the postgresql-clone PVC. This can be done using the oc patch command.
oc patch dc postgresql -n my-database-app --type json --patch '[{ "op": "replace", "path": "/spec/template/spec/volumes/0/persistentVolumeClaim/claimName", "value": "postgresql-clone" }]'deploymentconfig.apps.openshift.io/postgresql patchedAfter modifying the deployment with the clone PVC the rails-pgsql-persistent deployment needs to be scaled back up.
oc scale deploymentconfig rails-pgsql-persistent -n my-database-app --replicas=1deploymentconfig.apps.openshift.io/rails-pgsql-persistent scaledNow check to see that there is a new postgresql and rails-pgsql-persistent Pod.
oc get pods -n my-database-app | egrep 'rails|postgresql' | egrep -v 'deploy|build|hook'postgresql-4-hv5kb 1/1 Running 0 5m58s
rails-pgsql-persistent-1-dhwhz 1/1 Running 0 5m10sGo back to the browser tab where you created your article using this link:
oc get route rails-pgsql-persistent -n my-database-app -o jsonpath --template="http://{.spec.host}/articles{'\n'}"If you refresh the browser you will see the application is back online and you have your articles. You can even add more articles now.
This process shows the pratical reasons to create a PVC clone if you are testing an application where data corruption is a possibility and you want a known good copy or clone.
Let’s next look at a similar feature, creating a PVC snapshot.
5.2. PVC Snapshot
Creating the first snapshot of a PVC is the same as creating a clone from that PVC. However, after an initial PVC snapshot is created, subsequent snapshots only save the delta between the initial snapshot the current contents of the PVC. Snapshots are frequently used by backup utilities which schedule incremental backups on a periodic basis (e.g. hourly). Snapshots are more capacity efficient than creating full clones each time period (e.g. hourly), as only the deltas to the PVC are stored in each snapshot.
A snapshot can be used to provision a new volume by creating a PVC clone. The volume clone can be used for application recovery as demonstrated in the previous section.
5.2.1. VolumeSnapshotClass
To create a volume snapshot there first must be VolumeSnapshotClass resources that will be referenced in the VolumeSnapshot definition. The deployment of OCS (must be version 4.6 or greater) creates two VolumeSnapshotClass resources for creating snapshots.
oc get volumesnapshotclasses$ oc get volumesnapshotclasses
NAME DRIVER DELETIONPOLICY AGE
ocs-storagecluster-cephfsplugin-snapclass openshift-storage.cephfs.csi.ceph.com Delete 4d23h
ocs-storagecluster-rbdplugin-snapclass openshift-storage.rbd.csi.ceph.com Delete 4d23hYou can see by the naming of the VolumeSnapshotClass that one is for creating CephFS volume snapshots and the other is for Ceph RBD.
5.2.2. Provisioning a CSI Volume snapshot
For this exercise we will use the already created PVC my-shared-storage. Make sure you have done section Create a new OCP application deployment using CephFS volume before proceeding.
The operation of creating a snapshot can be done using the OpenShift Web Console or by creating the resource via a YAML file.
apiVersion: snapshot.storage.k8s.io/v1beta1
kind: VolumeSnapshot
metadata:
name: my-shared-storage-snapshot
namespace: my-shared-storage
spec:
volumeSnapshotClassName: ocs-storagecluster-cephfsplugin-snapclass
source:
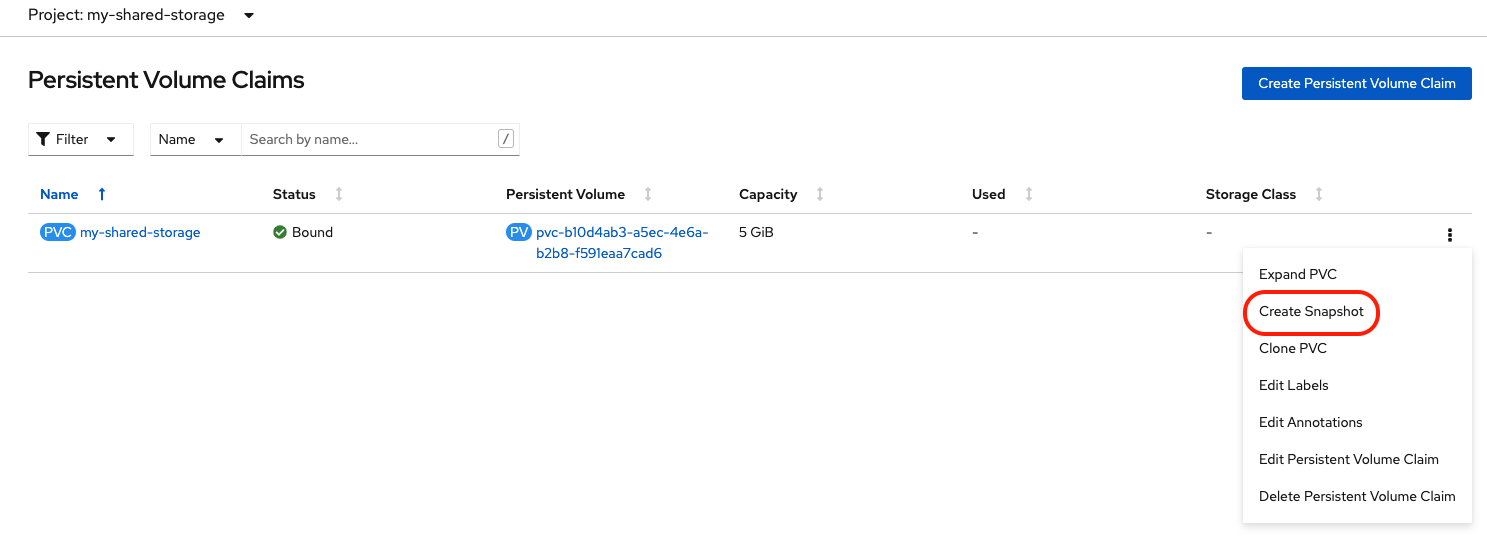
persistentVolumeClaimName: my-shared-storageDoing the same operation in the OpenShift Web Console would require navigating to Storage → Persistent Volume Claim and choosing Create Snapshot.
Now create a snapshot for CephFS volume my-shared-storage.
curl -s https://raw.githubusercontent.com/red-hat-storage/ocs-training/master/training/modules/ocs4/attachments/my-shared-storage-snapshot.yaml | oc apply -f -volumesnapshot.snapshot.storage.k8s.io/my-shared-storage-snapshot createdNow check to see there is a new VolumeSnapshot.
oc get volumesnapshot -n my-shared-storageNAME READYTOUSE SOURCEPVC SOURCESNAPSHOTCONTENT RESTORESIZE SNAPSHOTCLASS SNAPSHOTCONTENT CREATIONTIME AGE
my-shared-storage-snapshot true my-shared-storage 5Gi ocs-storagecluster-cephfsplugin-snapclass snapcontent-2d4729bc-a127-4da6-930d-2a7d0125d3b7 24s 26s5.2.3. Restoring Volume Snapshot to clone PVC
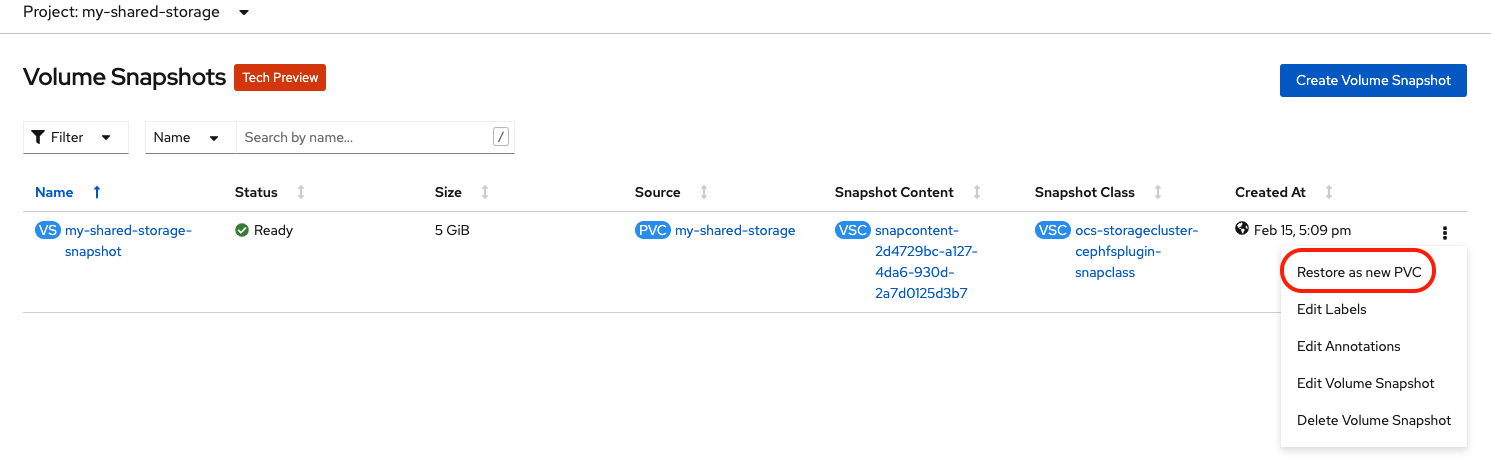
You can now restore the new VolumeSnapshot in the OpenShift Web Console. Navigate to Storage → Volume Snapshots. Select Restore as new PVC. Make sure to have the my-shared-storage project selected at the top left.
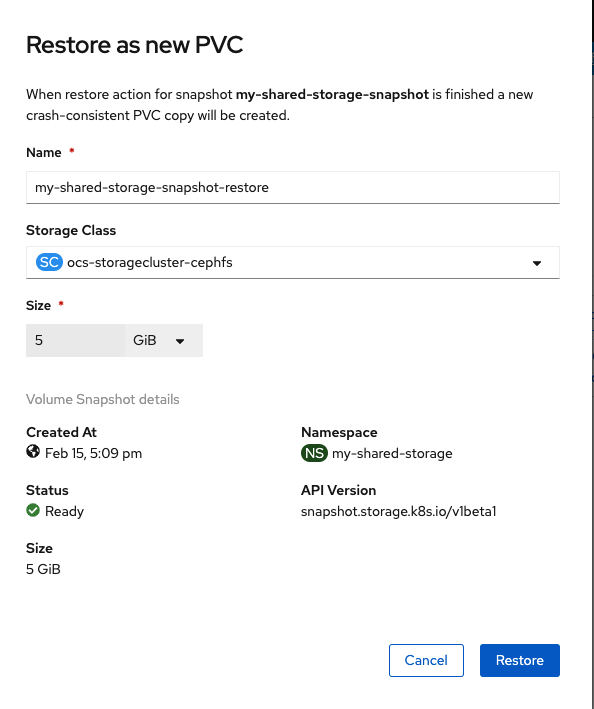
Chose the correct StorageClass to create the new clone from snapshot PVC and select Restore. The size of the new PVC is greyed out and is same as the parent or original PVC my-shared-storage.
Check to see if there is a new PVC restored from the VolumeSnapshot.
oc get pvc -n my-shared-storage | grep restoremy-shared-storage-snapshot-restore Bound pvc-24999d30-09f1-4142-b150-a5486df7b3f1 5Gi RWX ocs-storagecluster-cephfs 108sThe output shows a new PVC that could be used to recover an application if there is corruption or lost data.
6. Using OCS for Prometheus Metrics
OpenShift ships with a pre-configured and self-updating monitoring stack that is based on the Prometheus open source project and its wider eco-system. It provides monitoring of cluster components and ships with a set of alerts to immediately notify the cluster administrator about any occurring problems. For production environments, it is highly recommended to configure persistent storage using block storage technology. OCS 4 provide block storage using Ceph RBD volumes. Running cluster monitoring with persistent storage means that your metrics are stored to a persistent volume and can survive a pod being restarted or recreated. This section will detail how to migrate Prometheus and AlertManager storage to Ceph RBD volumes for persistence.
First, let’s discover what Pods and PVCs are installed in the
openshift-monitoring namespace. In the prior module, OpenShift Infrastructure
Nodes, the Prometheus and AlertManager resources were moved to the OCP infra
nodes.
oc get pods,pvc -n openshift-monitoringNAME READY STATUS RESTARTS AGE
pod/alertmanager-main-0 5/5 Running 0 6d21h
pod/alertmanager-main-1 5/5 Running 0 6d21h
pod/alertmanager-main-2 5/5 Running 0 6d21h
pod/cluster-monitoring-operator-595888fddd-mcgnl 2/2 Running 0 4h49m
pod/grafana-65454464fd-5spx2 2/2 Running 0 26h
pod/kube-state-metrics-7cb89d65d4-p9hbd 3/3 Running 0 6d21h
pod/node-exporter-96zjb 2/2 Running 0 6d21h
pod/node-exporter-9jjdk 2/2 Running 0 2d17h
pod/node-exporter-dhnt4 2/2 Running 0 6d21h
pod/node-exporter-kg2fb 2/2 Running 0 2d17h
pod/node-exporter-l27n2 2/2 Running 0 16h
pod/node-exporter-qq4g7 2/2 Running 0 16h
pod/node-exporter-rfnxb 2/2 Running 0 16h
pod/node-exporter-v8kpq 2/2 Running 0 2d17h
pod/node-exporter-wvm8n 2/2 Running 0 6d21h
pod/node-exporter-wwcr9 2/2 Running 0 6d21h
pod/node-exporter-z8r98 2/2 Running 0 6d21h
pod/openshift-state-metrics-57969c7f87-h8fm4 3/3 Running 0 6d21h
pod/prometheus-adapter-cb658c44-zmcww 1/1 Running 0 2d22h
pod/prometheus-adapter-cb658c44-zsn85 1/1 Running 0 2d22h
pod/prometheus-k8s-0 6/6 Running 0 6d21h
pod/prometheus-k8s-1 6/6 Running 0 6d21h
pod/prometheus-operator-8594bd77df-ftwvl 2/2 Running 0 26h
pod/telemeter-client-79d7ddbf84-ft97l 3/3 Running 0 42h
pod/thanos-querier-787547fbd6-qw9tr 5/5 Running 0 6d21h
pod/thanos-querier-787547fbd6-xdsmm 5/5 Running 0 6d21hAt this point there are no PVC resources because Prometheus and AlertManager are both using ephemeral (EmptyDir) storage. This is the way OpenShift is initially installed. The Prometheus stack consists of the Prometheus database and the alertmanager data. Persisting both is best-practice since data loss on either of these will cause you to lose your metrics and alerting data.
6.1. Modifying your Prometheus environment
For Prometheus every supported configuration change is controlled through a central ConfigMap, which needs to exist before we can make changes. When you start off with a clean installation of Openshift, the ConfigMap to configure the Prometheus environment may not be present. To check if your ConfigMap is present, execute this:
oc -n openshift-monitoring get configmap cluster-monitoring-configError from server (NotFound): configmaps "cluster-monitoring-config" not foundNAME DATA AGE
cluster-monitoring-config 1 116mIf you are missing the ConfigMap, create it using this command:
curl -s https://raw.githubusercontent.com/red-hat-storage/ocs-training/master/training/modules/ocs4/attachments/cluster-monitoring-config.yaml | oc apply -f -configmap/cluster-monitoring-config createdYou can view the ConfigMap with the following command:
The size of the Ceph RBD volumes, 40Gi, can be modified to be larger or
smaller depending on requirements.
|
oc -n openshift-monitoring get configmap cluster-monitoring-config -o yaml | more[...]
volumeClaimTemplate:
metadata:
name: prometheusdb
spec:
storageClassName: ocs-storagecluster-ceph-rbd
resources:
requests:
storage: 40Gi
[...]
volumeClaimTemplate:
metadata:
name: alertmanager
spec:
storageClassName: ocs-storagecluster-ceph-rbd
resources:
requests:
storage: 40Gi
[...]Once you create this new ConfigMap cluster-monitoring-config, the
affected Pods will automatically be restarted and the new storage will be
mounted in the Pods.
| It is not possible to retain data that was written on the default EmptyDir-based or ephemeral installation. Thus you will start with an empty DB after changing the backend storage thereby starting over with metric collection and reporting. |
After a couple of minutes, the AlertManager and Prometheus Pods will have
restarted and you will see new PVCs in the openshift-monitoring namespace
that they are now providing persistent storage.
oc get pods,pvc -n openshift-monitoringNAME STATUS VOLUME CAPACITY ACCESS MODES STORAGECLASS AGE
[...]
alertmanager-alertmanager-main-0 Bound pvc-733be285-aaf9-4334-9662-44b63bb4efdf 40Gi RWO ocs-storagecluster-ceph-rbd 3m37s
alertmanager-alertmanager-main-1 Bound pvc-e07ebe61-de5d-404c-9a25-bb3a677281c5 40Gi RWO ocs-storagecluster-ceph-rbd 3m37s
alertmanager-alertmanager-main-2 Bound pvc-9de2edf2-9f5e-4f62-8aa7-ecfd01957748 40Gi RWO ocs-storagecluster-ceph-rbd 3m37s
prometheusdb-prometheus-k8s-0 Bound pvc-5b845908-d929-4326-976e-0659901468e9 40Gi RWO ocs-storagecluster-ceph-rbd 3m31s
prometheusdb-prometheus-k8s-1 Bound pvc-f2d22176-6348-451f-9ede-c00b303339af 40Gi RWO ocs-storagecluster-ceph-rbd 3m31sYou can validate that Prometheus and AlertManager are working correctly after moving to persistent storage Monitoring the OCS environment in a later section of this lab guide.
7. Create a new OCP application deployment using an Object Bucket
In this section, you will deploy a new OCP application that uses Object Bucket
Claims (OBCs) to create dynamic buckets via the Multicloud Object Gateway
(MCG). You will also use the MCG Console to validate new objects in the
Object Bucket.
The MCG Console is not fully integrated with the Openshift Web Console
and resources created in the MCG Console are not synchronized back to the
Openshift Cluster. For MCG features such as Namespace buckets, please use the
MCG console to configure.
|
7.1. Checking MCG status
MCG status can be checked with the NooBaa CLI. You may download the NooBaa CLI from the NooBaa Operator releases page: https://github.com/noobaa/noobaa-operator/releases. There is also instructions at Install the NooBaa CLI client.
Make sure you are in the openshift-storage project when you execute this
command.
noobaa status -n openshift-storageINFO[0001] CLI version: 5.7.0
INFO[0001] noobaa-image: registry.redhat.io/ocs4/mcg-core-rhel8@sha256:6ff8645efdde95fa97d496084d3555b768089
5f0b79c147f2a880b43742af3a4
INFO[0001] operator-image: registry.redhat.io/ocs4/mcg-rhel8-operator@sha256:6faecc43b775d9083d01f11705334e2
afdee11eb585b7761851781c94df124ee
INFO[0001] noobaa-db-image: registry.redhat.io/rhel8/postgresql-12@sha256:f486bbe07f1ddef166bab5a2a6bdcd0e63
e6e14d15b42d2425762f83627747bf
INFO[0001] Namespace: openshift-storage
INFO[0001]
INFO[0001] CRD Status:
INFO[0001] ✅ Exists: CustomResourceDefinition "noobaas.noobaa.io"
INFO[0001] ✅ Exists: CustomResourceDefinition "backingstores.noobaa.io"
INFO[0001] ✅ Exists: CustomResourceDefinition "namespacestores.noobaa.io"
INFO[0001] ✅ Exists: CustomResourceDefinition "bucketclasses.noobaa.io"
INFO[0001] ✅ Exists: CustomResourceDefinition "objectbucketclaims.objectbucket.io"
INFO[0001] ✅ Exists: CustomResourceDefinition "objectbuckets.objectbucket.io"
INFO[0001]
INFO[0001] Operator Status:
INFO[0001] ✅ Exists: Namespace "openshift-storage"
INFO[0001] ✅ Exists: ServiceAccount "noobaa"
INFO[0001] ✅ Exists: Role "ocs-operator.v4.7.2-noobaa-79b9f54f59"
INFO[0001] ✅ Exists: RoleBinding "ocs-operator.v4.7.2-noobaa-79b9f54f59"
INFO[0001] ✅ Exists: ClusterRole "ocs-operator.v4.7.2-6d97965cd4"
INFO[0001] ✅ Exists: ClusterRoleBinding "ocs-operator.v4.7.2-6d97965cd4"
INFO[0001] ✅ Exists: Deployment "noobaa-operator"
INFO[0001]
INFO[0001] System Status:
INFO[0001] ✅ Exists: NooBaa "noobaa"
INFO[0001] ✅ Exists: StatefulSet "noobaa-core"
INFO[0001] ✅ Exists: Service "noobaa-mgmt"
INFO[0001] ✅ Exists: Service "s3"
INFO[0001] ✅ Exists: Secret "noobaa-db"
INFO[0001] ✅ Exists: StatefulSet "noobaa-db-pg"
INFO[0001] ✅ Exists: Service "noobaa-db-pg"
INFO[0001] ✅ Exists: Secret "noobaa-server"
INFO[0001] ✅ Exists: Secret "noobaa-operator"
INFO[0001] ✅ Exists: Secret "noobaa-endpoints"
INFO[0001] ✅ Exists: Secret "noobaa-admin"
INFO[0001] ✅ Exists: Secret "noobaa-root-master-key"
INFO[0001] ✅ Exists: StorageClass "openshift-storage.noobaa.io"
INFO[0001] ✅ Exists: BucketClass "noobaa-default-bucket-class"
INFO[0001] ✅ Exists: Deployment "noobaa-endpoint"
INFO[0001] ✅ Exists: HorizontalPodAutoscaler "noobaa-endpoint"
INFO[0001] ✅ (Optional) Exists: BackingStore "noobaa-default-backing-store"
INFO[0001] ✅ (Optional) Exists: CredentialsRequest "noobaa-aws-cloud-creds"
INFO[0001] ⬛ (Optional) Not Found: CredentialsRequest "noobaa-azure-cloud-creds"
INFO[0001] ⬛ (Optional) Not Found: Secret "noobaa-azure-container-creds"
INFO[0001] ⬛ (Optional) Not Found: Secret "noobaa-gcp-bucket-creds"
INFO[0001] ⬛ (Optional) Not Found: CredentialsRequest "noobaa-gcp-cloud-creds"
INFO[0001] ✅ (Optional) Exists: PrometheusRule "noobaa-prometheus-rules"
INFO[0001] ✅ (Optional) Exists: ServiceMonitor "noobaa-mgmt-service-monitor"
INFO[0001] ✅ (Optional) Exists: ServiceMonitor "s3-service-monitor"
INFO[0001] ✅ (Optional) Exists: Route "noobaa-mgmt"
INFO[0001] ✅ (Optional) Exists: Route "s3"
INFO[0001] ✅ Exists: PersistentVolumeClaim "db-noobaa-db-pg-0"
INFO[0001] ✅ System Phase is "Ready"
INFO[0001] ✅ Exists: "noobaa-admin"
#------------------#
#- Mgmt Addresses -#
#------------------#
ExternalDNS : [https://noobaa-mgmt-openshift-storage.apps.cluster-ocs4-51af.ocs4-51af.sandbox899.opentlc.com
https://adab90f297fb14613a664b1e9265e801-915596537.us-east-2.elb.amazonaws.com:443]
ExternalIP : []
NodePorts : [https://10.0.131.234:31726]
InternalDNS : [https://noobaa-mgmt.openshift-storage.svc:443]
InternalIP : [https://172.30.48.41:443]
PodPorts : [https://10.130.2.17:8443]
#--------------------#
#- Mgmt Credentials -#
#--------------------#
email : admin@noobaa.io
password : 9rEEE9bjw+o9l8myraxpwQ==
#----------------#
#- S3 Addresses -#
#----------------#
ExternalDNS : [https://s3-openshift-storage.apps.cluster-ocs4-51af.ocs4-51af.sandbox899.opentlc.com https://
a91eba9e06d8649c684907cdac7041b1-381423410.us-east-2.elb.amazonaws.com:443]
ExternalIP : []
NodePorts : [https://10.0.131.234:30496]
InternalDNS : [https://s3.openshift-storage.svc:443]
InternalIP : [https://172.30.25.11:443]
PodPorts : [https://10.130.2.19:6443]
#------------------#
#- S3 Credentials -#
#------------------#
AWS_ACCESS_KEY_ID : a0pwpf0vvE3E8U9dezYu
AWS_SECRET_ACCESS_KEY : 4qGN6Nj47A7G7weOMINnq1fEdjby3LMC/Lfvd4lJ
#------------------#
#- Backing Stores -#
#------------------#
NAME TYPE TARGET-BUCKET PHASE AGE
noobaa-default-backing-store aws-s3 nb.1626480406832.ocs4-51af.sandbox899.opentlc.com Ready 15m43s
#------------------#
#- Bucket Classes -#
#------------------#
NAME PLACEMENT NAMESPACE-POL
ICY PHASE AGE
noobaa-default-bucket-class {"tiers":[{"backingStores":["noobaa-default-backing-store"]}]} null
Ready 15m43s
#-----------------#
#- Bucket Claims -#
#-----------------#
No OBCs found.The NooBaa status command will first check on the environment and will then print all the information about the environment. Besides the status of the MCG, the second most intersting information for us are the available S3 addresses that we can use to connect to our MCG buckets. We can chose between using the external DNS which incurs DNS traffic cost, or route internally inside of our Openshift cluster.
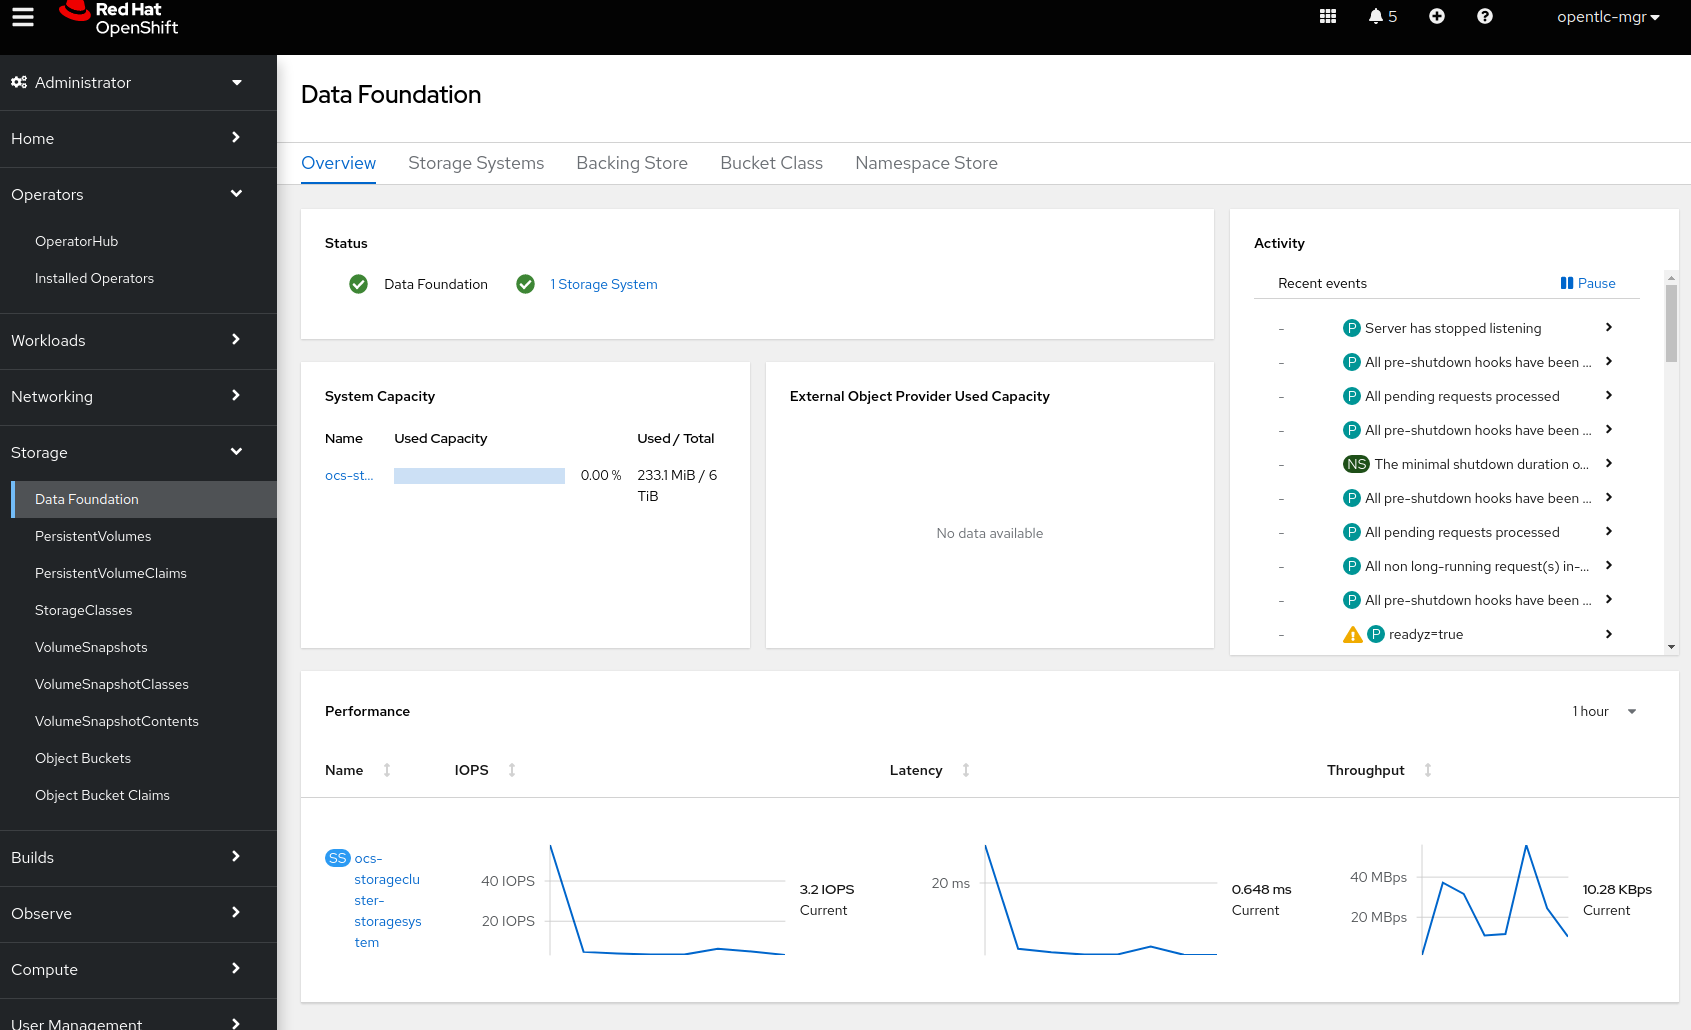
You can get a more basic overview of the MCG status using the Object Service
Dashboard. To reach this, log into the Openshift Web Console, click on
Home and select the Overview item. In the main view, select Object
Service in the top navigation bar. This dashboard does not give you connection
information for your S3 endpoint, but offers Graphs and runtime information
about the usage of your S3 backend as well as a link to the MCG Console.
7.2. Creating and Using Object Bucket Claims
MCG ObjectBucketClaims (OBCs) are used to dynamically create S3 compatible buckets that can be used by an OCP application. When an OBC is created MCG creates a new ObjectBucket (OB), ConfigMap (CM) and Secret that together contain all the information your application needs to connect to the new bucket from within your deployment.
To demonstrate this feature we will use the Photo-Album demo application.
First download and extract the photo-album tarball.
curl -L -s https://github.com/red-hat-storage/demo-apps/blob/main/packaged/photo-album.tgz?raw=true | tar xvzphoto-album/
photo-album/documentation/
photo-album/app/
photo-album/demo.sh
[...]Then, run the application startup script which will build and deploy the application to your cluster.
cd photo-album
./demo.sh| Please make sure you follow the continuation prompts by pressing enter. |
[ OK    ] Using apps.cluster-7c31.7c31.sandbox905.opentlc.com as our base domain

Object Bucket Demo

 * Cleanup existing environment

Press any key to continue...
[ OK    ] oc delete --ignore-not-found=1 -f app.yaml

[ OK    ] oc delete --ignore-not-found=1 bc photo-album -n demo
buildconfig.build.openshift.io "photo-album" deleted

 * Import dependencies and create build config
-./demo.sh
[ OK    ] Using apps.cluster-7c31.7c31.sandbox905.opentlc.com as our base domain

Object Bucket Demo

 * Cleanup existing environment

Press any key to continue...
[ OK    ] oc delete --ignore-not-found=1 -f app.yaml

[ OK    ] oc delete --ignore-not-found=1 bc photo-album -n demo
buildconfig.build.openshift.io "photo-album" deleted

 * Import dependencies and create build config

[...]
 OK    ] oc start-build photo-album --from-dir . -F -n demo
photo-album setup
/opt/app-root/src/demo-apps/photo-album| Deployment might take up to 5 minutes or more to complete. |
Check the photo-album deployment is complete by running:
oc -n demo get podsNAME READY STATUS RESTARTS AGE
photo-album-1-build 0/1 Completed 0 10m
photo-album-1-deploy 0/1 Completed 0 10m
photo-album-1-rtplt 1/1 Running 0 10mNow that the photo-album application has been deployed you can view the ObjectBucketClaim it created. Run the following:
oc -n demo get obcNAME STORAGE-CLASS PHASE AGE
photo-album openshift-storage.noobaa.io Bound 23mTo view the ObjectBucket (OB) that was created by the OBC above run the following:
oc get obNAME STORAGE-CLASS CLAIM-NAMESPACE CLAIM-NAME RECLAIM-POLICY PHASE AGE
obc-demo-photo-album openshift-storage.noobaa.io demo photo-album Delete Bound 23m| OBs, similar to PVs, are cluster-scoped resources so therefore adding the namespace is not needed. |
You can also view the new bucket ConfigMap and Secret using the following commands.
The ConfigMap will contain important information such as the bucket name, service and port. All are used to configure the connection from within the deployment to the s3 endpoint.
To view the ConfigMap created by the OBC, run the following:
oc -n demo get cm photo-album -o yaml | moreapiVersion: v1
data:
BUCKET_HOST: s3.openshift-storage.svc
BUCKET_NAME: photo-album-2c0d8504-ae02-4632-af83-b8b458b9b923
BUCKET_PORT: "443"
BUCKET_REGION: ""
BUCKET_SUBREGION: ""
kind: ConfigMap
[...]The Secret will contain the credentials required for the application to connect and access the new object bucket. The credentials or keys are base64 encoded in the Secret.
To view the Secret created for the OBC run the following:
oc -n demo get secret photo-album -o yaml | moreapiVersion: v1
data:
AWS_ACCESS_KEY_ID: MTAyc3pJNnBsM3dXV0hOUzUyTEk=
AWS_SECRET_ACCESS_KEY: cWpyWWhuendDcjNaR1ZyVkZVN1p4c2hRK2xicy9XVW1ETk50QmJpWg==
kind: Secret
[...]As you can see when the new OBC and OB are created, MCG creates an associated Secret and ConfigMap which contain all the information required for our photo-album application to use the new bucket.
In order to view the details of the ObjectBucketClaim view the start of photo-album/app.yaml.
---
apiVersion: objectbucket.io/v1alpha1
kind: ObjectBucketClaim
metadata:
  name: "photo-album"
  namespace: demo
spec:
  generateBucketName: "photo-album"
  storageClassName: openshift-storage.noobaa.io
---
[...]
To view exactly how the application uses the information in the new Secret and ConfigMap have a look at the file photo-album/app.yaml after you have deployed the app. In the DeploymentConfig specification section, find env: and you can see how the ConfigMap and Secret details are mapped to environment variables.
[...]
     spec:
        containers:
        - image: image-registry.openshift-image-registry.svc:5000/default/photo-album
          name: photo-album
          env:
            - name: ENDPOINT_URL
              value: 'https://s3-openshift-storage.apps.cluster-7c31.7c31.sandbox905.opentlc.com'
            - name: BUCKET_NAME
              valueFrom:
                configMapKeyRef:
                  name: photo-album
                  key: BUCKET_NAME
            - name: AWS_ACCESS_KEY_ID
              valueFrom:
                secretKeyRef:
                  name: photo-album
                  key: AWS_ACCESS_KEY_ID
            - name: AWS_SECRET_ACCESS_KEY
              valueFrom:
                secretKeyRef:
                  name: photo-album
                  key: AWS_SECRET_ACCESS_KEY
[...]
In order to create objects in your new bucket you must first find the route for the photo-album application.
oc get route photo-album -n demo -o jsonpath --template="http://{.spec.host}{'\n'}"http://photo-album.apps.cluster-7c31.7c31.sandbox905.opentlc.comCopy and paste this route into a web browser tab.
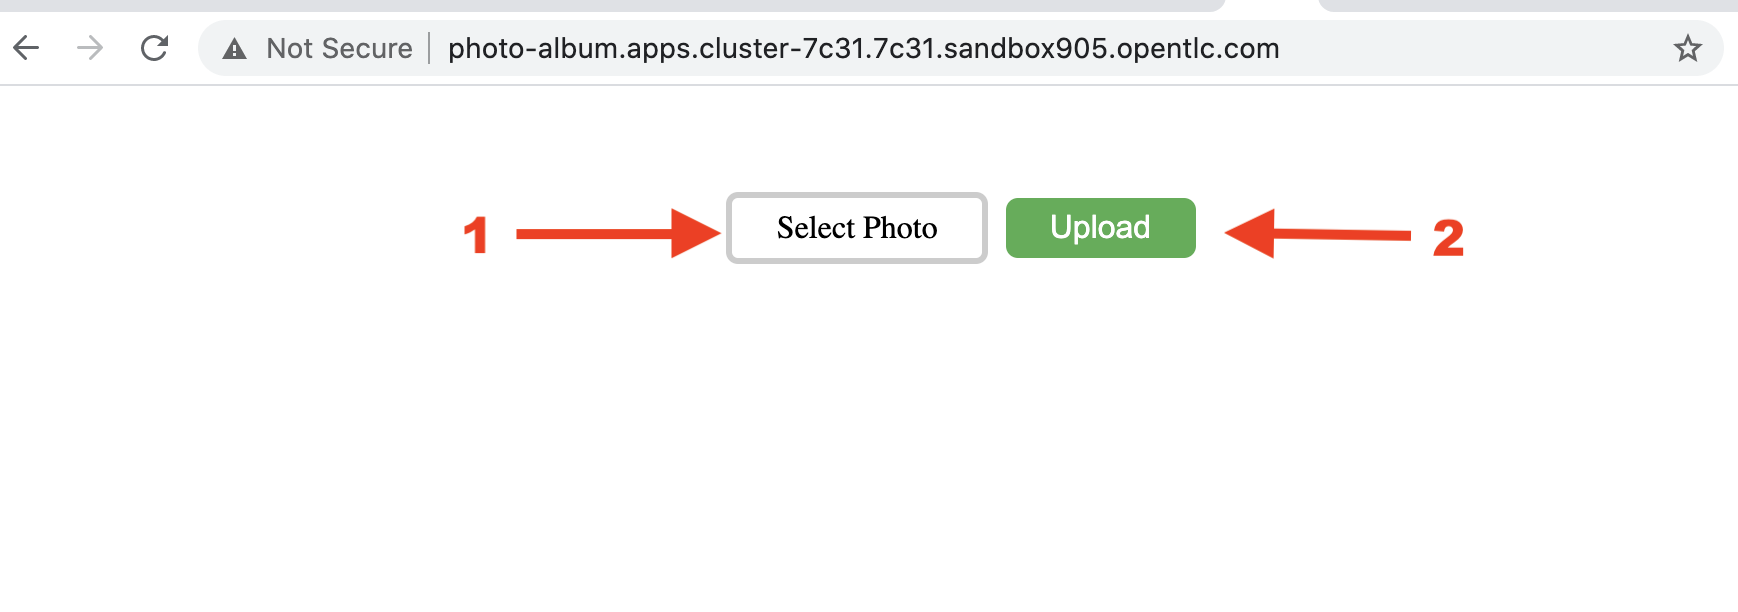
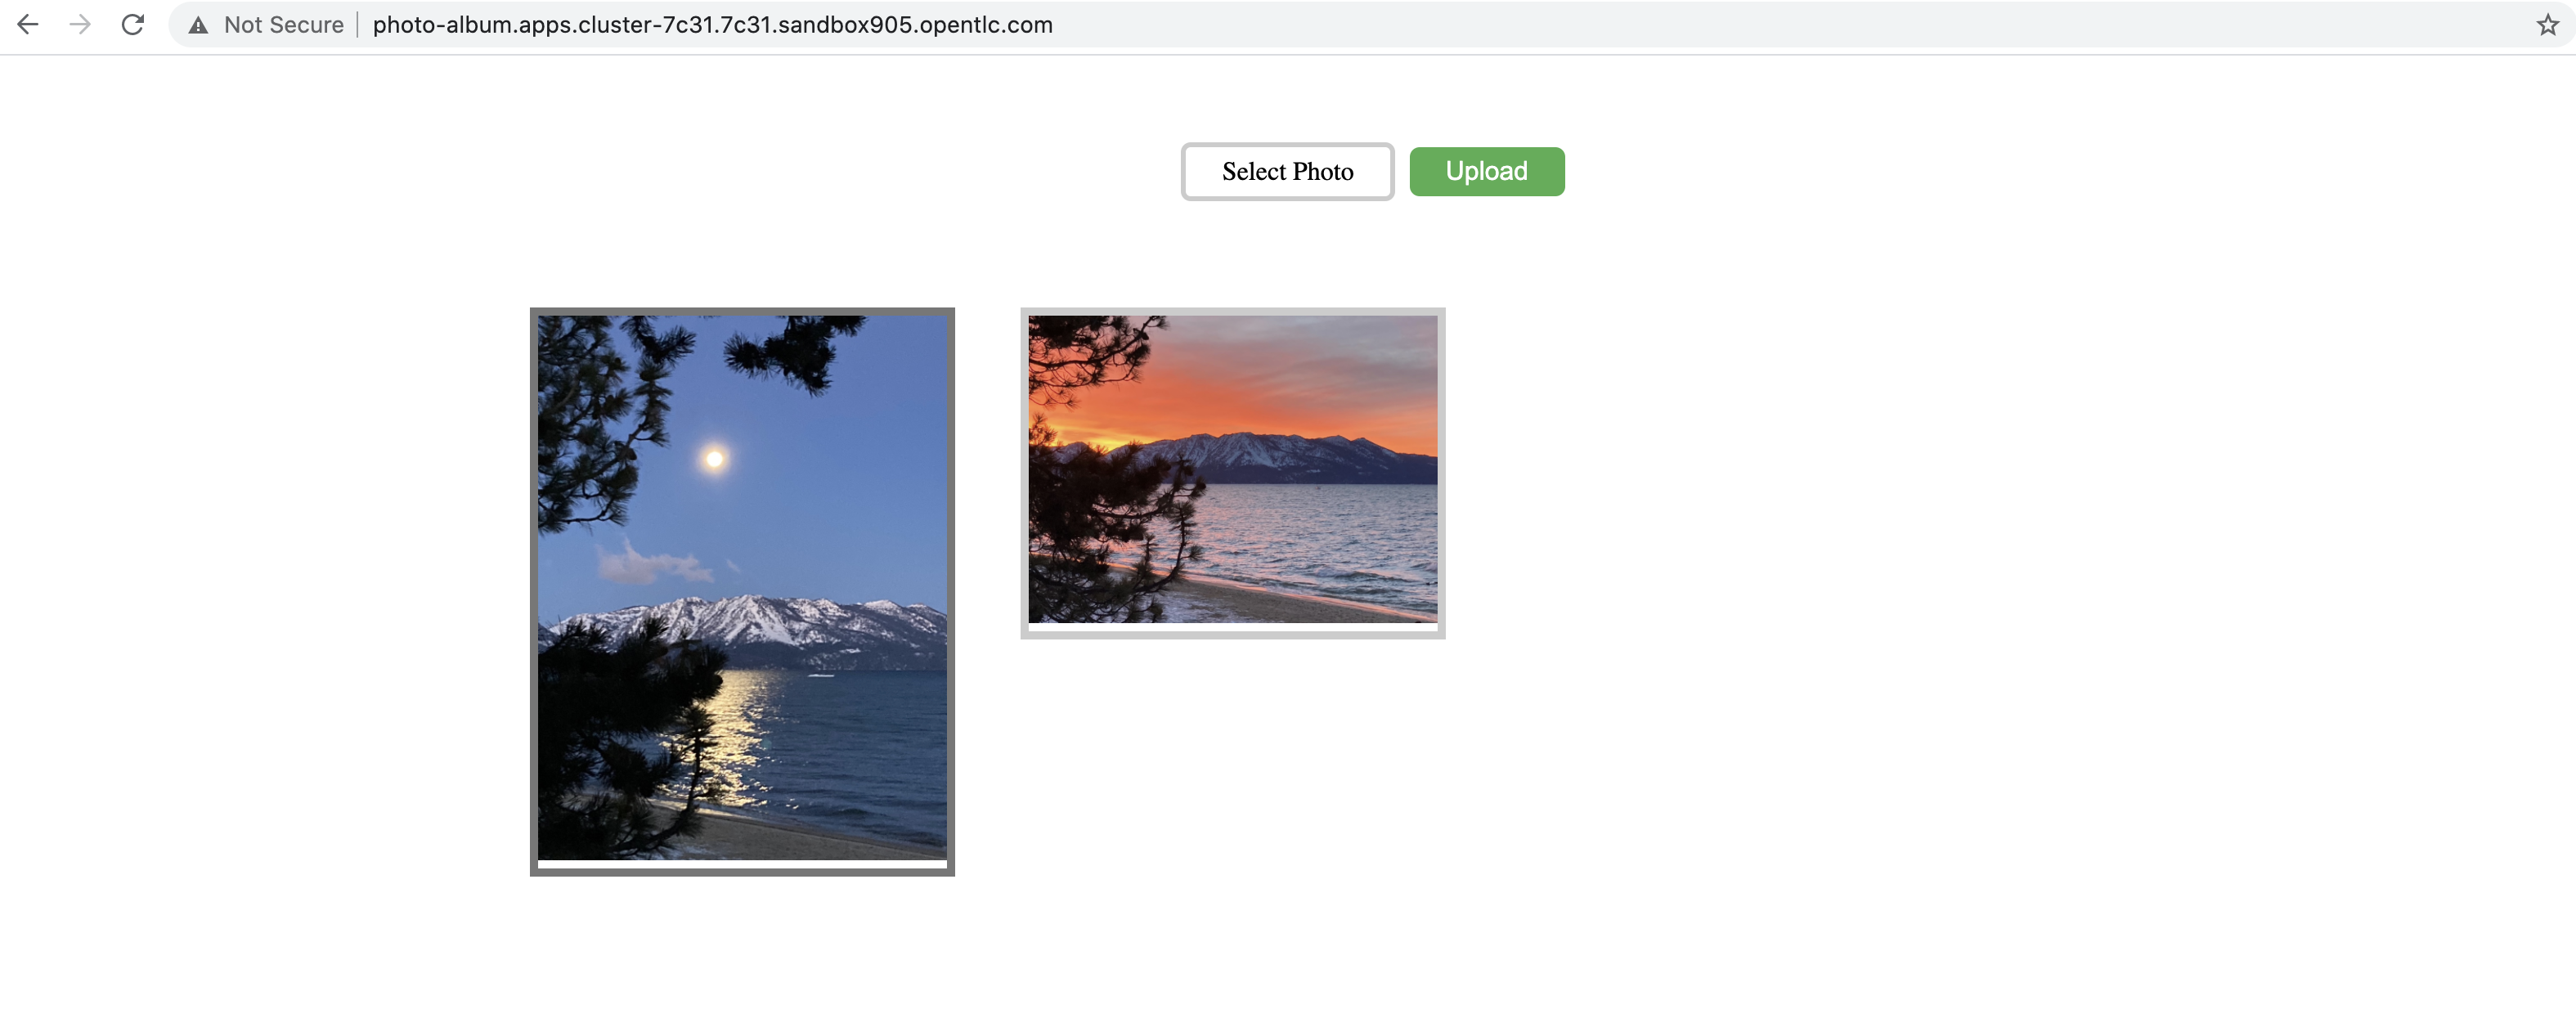
Select one or more photos of your choosing on your local machine. Then make sure to click the Upload button for each photo.
To confirm that the data is still available on Noobaa S3 object storage, reset the application and access it once more. Run the following command to restart the application, then wait up to a minute for it to start up again:
oc delete pods -l app=photo-albumpod "photo-album-1-jjwbq" deleted8. Adding storage to the Ceph Cluster
Adding storage to OCS adds capacity and performance to your already present cluster.
| The reason for adding more OCP worker nodes for storage is because the existing nodes do not have adequate CPU and/or Memory available. |
8.1. Add storage worker nodes
This section will explain how one can add more worker nodes to the present storage cluster. Afterwards follow the next sub-section on how to extend the OCS cluster to provision storage on these new nodes.
To add more nodes, we could either add more machinesets like we did before, or scale the already present OCS machinesets. For this training, we will spawn more workers by scaling the already present OCS worker instances up from 1 to 2 machines.
oc get machinesets -n openshift-machine-api | egrep 'NAME|workerocs'Example output:
NAME                                           DESIRED   CURRENT   READY   AVAILABLE   AGE
cluster-ocs4-8613-bc282-workerocs-us-east-2a   1         1         1       1           2d
cluster-ocs4-8613-bc282-workerocs-us-east-2b   1         1         1       1           2d
cluster-ocs4-8613-bc282-workerocs-us-east-2c   1         1         1       1           2d
Let’s scale the workerocs machinesets up with this command:
oc get machinesets -n openshift-machine-api -o name | grep workerocs | xargs -n1 -t oc scale -n openshift-machine-api --replicas=2oc scale -n openshift-machine-api --replicas=2 machineset.machine.openshift.io/cluster-ocs4-8613-bc282-workerocs-us-east-2a
machineset.machine.openshift.io/cluster-ocs4-8613-bc282-workerocs-us-east-2a scaled
oc scale -n openshift-machine-api --replicas=2 machineset.machine.openshift.io/cluster-ocs4-8613-bc282-workerocs-us-east-2b
machineset.machine.openshift.io/cluster-ocs4-8613-bc282-workerocs-us-east-2b scaled
oc scale -n openshift-machine-api --replicas=2 machineset.machine.openshift.io/cluster-ocs4-8613-bc282-workerocs-us-east-2c
machineset.machine.openshift.io/cluster-ocs4-8613-bc282-workerocs-us-east-2c scaledWait until the new OCP workers are available. This could take 5 minutes or more
so be patient. You will know the new OCP worker nodes are available when you
have the number 2 in all columns.
watch "oc get machinesets -n openshift-machine-api | egrep 'NAME|workerocs'"You can exit by pressing Ctrl+C.
Once they are available, you can check to see if the new OCP worker nodes have the OCS label applied. The total of OCP nodes with the OCS label should now be six.
The OCS label cluster.ocs.openshift.io/openshift-storage= is already
applied because it is configured in the workerocs machinesets that you used
to create the new worker nodes.
|
oc get nodes -l cluster.ocs.openshift.io/openshift-storage -o jsonpath='{range .items[*]}{.metadata.name}{"\n"}'ip-10-0-147-230.us-east-2.compute.internal
ip-10-0-157-22.us-east-2.compute.internal
ip-10-0-175-8.us-east-2.compute.internal
ip-10-0-183-84.us-east-2.compute.internal
ip-10-0-209-53.us-east-2.compute.internal
ip-10-0-214-36.us-east-2.compute.internalNow that you have the new instances created with the OCS label, the next step is to add more storage to the Ceph cluster. The OCS operator will prefer the new OCP nodes with the OCS label because they have no OCS Pods scheduled yet.
8.2. Add storage capacity
In this section we will add storage capacity and performance to the configured OCS worker nodes and the Ceph cluster. If you have followed the previous section you should now have 6 OCS nodes.
To add storage, go to the Openshift Web Console and follow these steps to reach the OCS storage cluster overview:
-
Click on
Operatorson the left navigation bar -
Select
Installed Operatorsand selectopenshift-storageproject -
Click on
Openshift Container Storage Operator -
In the top navigation bar, scroll right to find the item
Storage Clusterand click on it
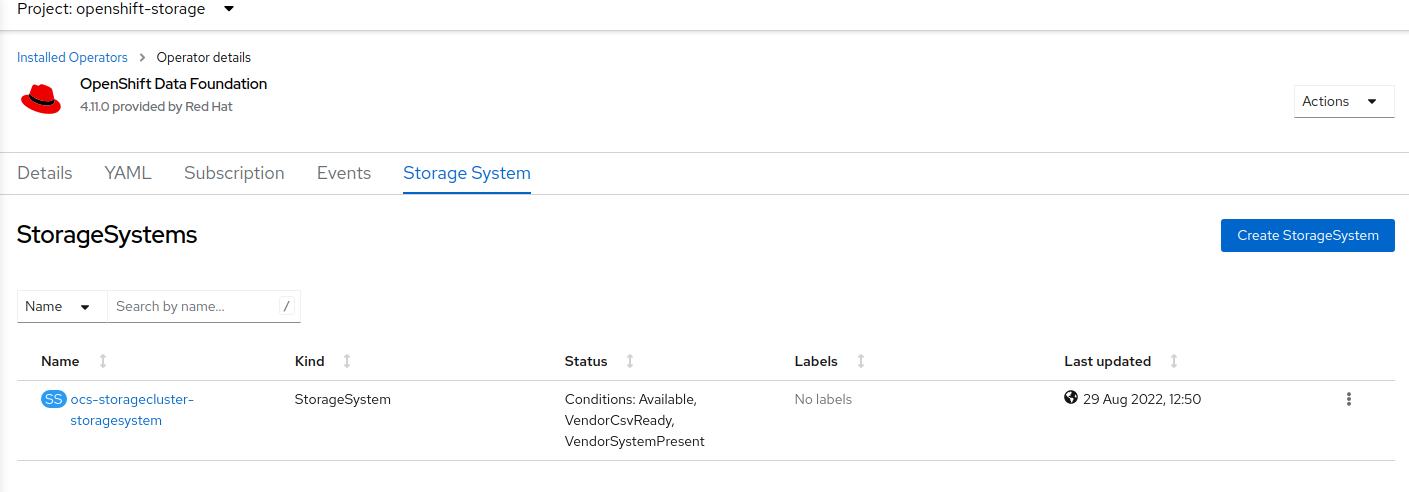
-
The visible list should list only one item - click on the three dots on the far right to extend the options menu
-
Select
Add Capacityfrom the options menu
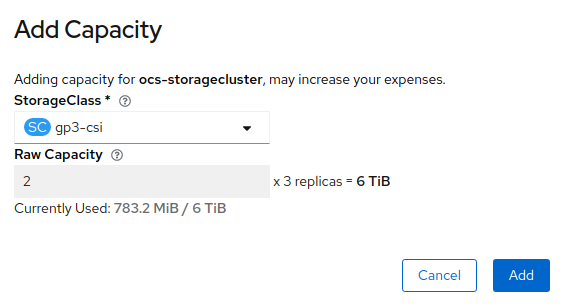
The storage class should be set to gp2. The added provisioned capacity will
be three times as much as you see in the Raw Capacity field, because OCS uses
a replica count of 3.
| The size chosen for OCS Service Capacity during the initial deployment of OCS is greyed out and cannot be changed. |
Once you are done with your setting, proceed by clicking on Add. You will
see the Status of the Storage Cluster is Ready.
It may take more than 5 minutes for new OSD pods to be in a Running state.
|
Use this command to see the new OSD pods:
oc get pod -o=custom-columns=NAME:.metadata.name,STATUS:.status.phase,NODE:.spec.nodeName -n openshift-storage | grep osd | grep -v preparerook-ceph-osd-0-7d45696497-jwgb7 Running ip-10-0-147-230.us-east-
2.compute.internal
rook-ceph-osd-1-6f49b665c7-gxq75 Running ip-10-0-209-53.us-east-2
.compute.internal
rook-ceph-osd-2-76ffc64cd-9zg65 Running ip-10-0-175-8.us-east-2.
compute.internal
rook-ceph-osd-3-97b5d9844-jpwgm Running ip-10-0-157-22.us-east-2
.compute.internal
rook-ceph-osd-4-9cb667b76-mftt9 Running ip-10-0-214-36.us-east-2
.compute.internal
rook-ceph-osd-5-55b8d97855-2bp85 Running ip-10-0-157-22.us-east-2
.compute.internalThis is everything that you need to do to extend the OCS storage.
8.3. Verify new storage
Once you added the capacity and made sure that the OSD pods are present, you can also optionally check the additional storage capacity using the Ceph toolbox created earlier. Follow these steps:
TOOLS_POD=$(oc get pods -n openshift-storage -l app=rook-ceph-tools -o name)
oc rsh -n openshift-storage $TOOLS_PODceph statussh-4.2# ceph status
cluster:
id: e3398039-f8c6-4937-ba9d-655f5c01e0ae
health: HEALTH_OK
services:
mon: 3 daemons, quorum a,b,c (age 25m)
mgr: a(active, since 24m)
mds: ocs-storagecluster-cephfilesystem:1 {0=ocs-storagecluster-cephfilesystem-a=up:active} 1 up:standby-replay
osd: 6 osds: 6 up (since 38s), 6 in (since 38s) (1)
task status:
scrub status:
mds.ocs-storagecluster-cephfilesystem-a: idle
mds.ocs-storagecluster-cephfilesystem-b: idle
data:
pools: 3 pools, 192 pgs
objects: 92 objects, 81 MiB
usage: 6.1 GiB used, 12 TiB / 12 TiB avail (2)
pgs: 192 active+clean
io:
client: 1.2 KiB/s rd, 1.7 KiB/s wr, 2 op/s rd, 0 op/s wrIn the Ceph status output, we can already see that:
| 1 | We now use 6 osds in total and they are up and in (meaning the daemons are running and being used to store data) |
| 2 | The available raw capacity has increased from 6 TiB to 12 TiB |
Besides that, nothing has changed in the output.
ceph osd crush treeID CLASS WEIGHT TYPE NAME
-1 12.00000 root default
-5 12.00000 region us-east-2
-4 4.00000 zone us-east-2a
-3 2.00000 host ocs-deviceset-gp2-0-data-0-9977n
0 ssd 2.00000 osd.0
-21 2.00000 host ocs-deviceset-gp2-2-data-1-nclgr (1)
4 ssd 2.00000 osd.4
-14 4.00000 zone us-east-2b
-13 2.00000 host ocs-deviceset-gp2-1-data-0-nnmpv
2 ssd 2.00000 osd.2
-19 2.00000 host ocs-deviceset-gp2-0-data-1-mg987 (1)
3 ssd 2.00000 osd.3
-10 4.00000 zone us-east-2c
-9 2.00000 host ocs-deviceset-gp2-2-data-0-mtbtj
1 ssd 2.00000 osd.1
-17 2.00000 host ocs-deviceset-gp2-0-data-2-l8tmb (1)
5 ssd 2.00000 osd.5| 1 | We now have additional hosts, which are extending the storage in the respective zone. |
Since our Ceph cluster’s CRUSH rules are set up to replicate data between the zones, this is an effective way to reduce the load on the 3 initial nodes.
Existing data on the original OSDs will be balanced out automatically, so that the old and the new OSDs share the load.
You can exit the toolbox by either pressing Ctrl+D or by executing exit.
exit9. Monitoring the OCS environment
This section covers the different tools available when it comes to monitoring OCS the environment. This section relies on using the OpenShift Web Console.
Individuals already familiar with OCP will feel comfortable with this section but for those who are not, it will be a good primer.
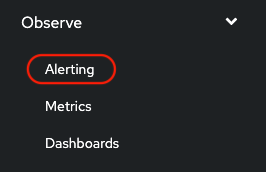
The monitoring tools are accessible through the main OpenShift Web Console left pane. Click the Monitoring menu item to expand and have access to the following 3 selections:
-
Alerting
-
Metrics
-
Dashboards
9.1. Alerting
Click on the Alerting item to open the Alert window as illustrated in the screen capture below.
This will take you to the Alerting homepage as illustrated below.
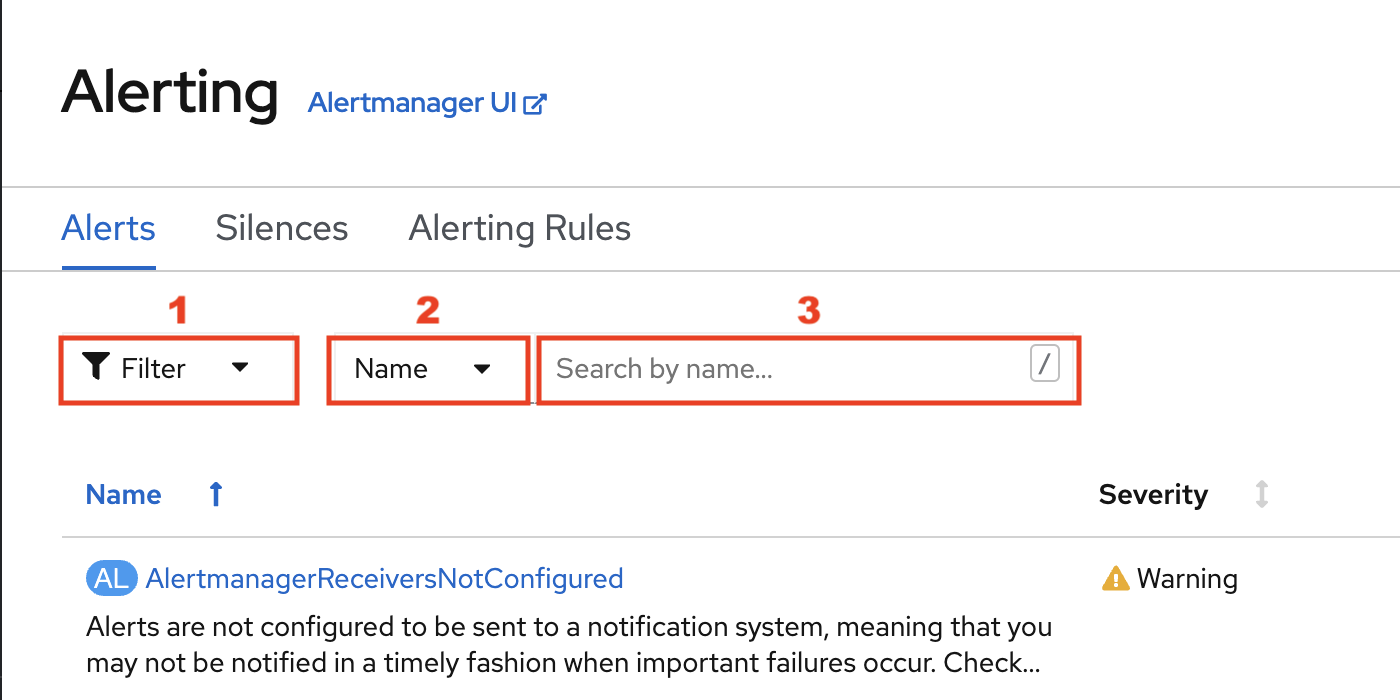
You can display the alerts in the main window using the filters at your disposal.
-
1 - Will let you select alerts by State, Severity and Sourc
-
2 - Will let you select if you want to search a specific character string using either the
Nameor theLabel -
3 - Will let you enter the character string you are searching for
The alert State can be.
-
Firing- Alert has been confirmed -
Silenced- Alerts that have been silenced while they were inPendingorFiringstate -
Pending- Alerts that have been triggered but not confirmed
An alert transitions from Pending to Firing state if the alert
persists for more than the amount of time configured in the alert definition
(e.g. 10 minutes for the CephClusterWarningState alert).
|
The alert Severity can be.
-
Critical- Alert is tagged as critical -
Warning- Alert is tagged as warning -
Info- Alert is tagged as informational -
None- The alert has noSeverityassigned
The alert Source can be.
-
Platform- Alert is generated by an OCP component -
User- Alert is generated by a user application
As illustrated below, alerts can be filtered precisely using multiple criteria.
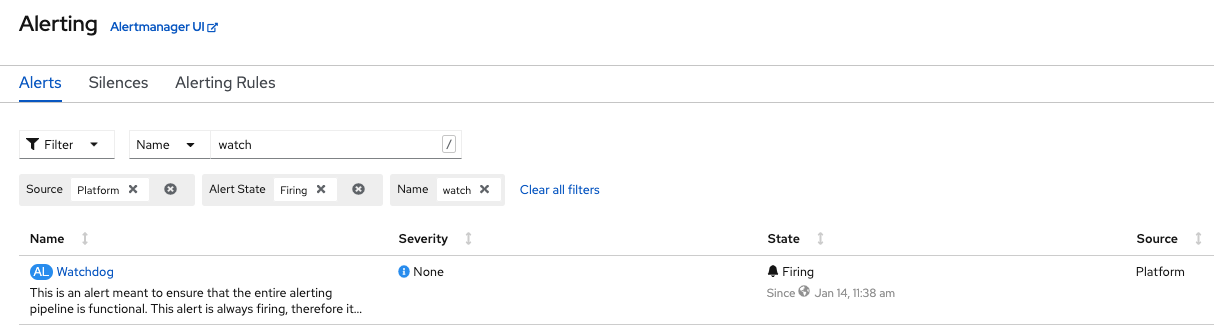
| You can clear all filters to view all the existing alerts. |
If you select View Alerting Rule you will get access to the details of the
rule that triggered the alert. The details include the Prometheus query used
by the alert to perform the detection of the condition.

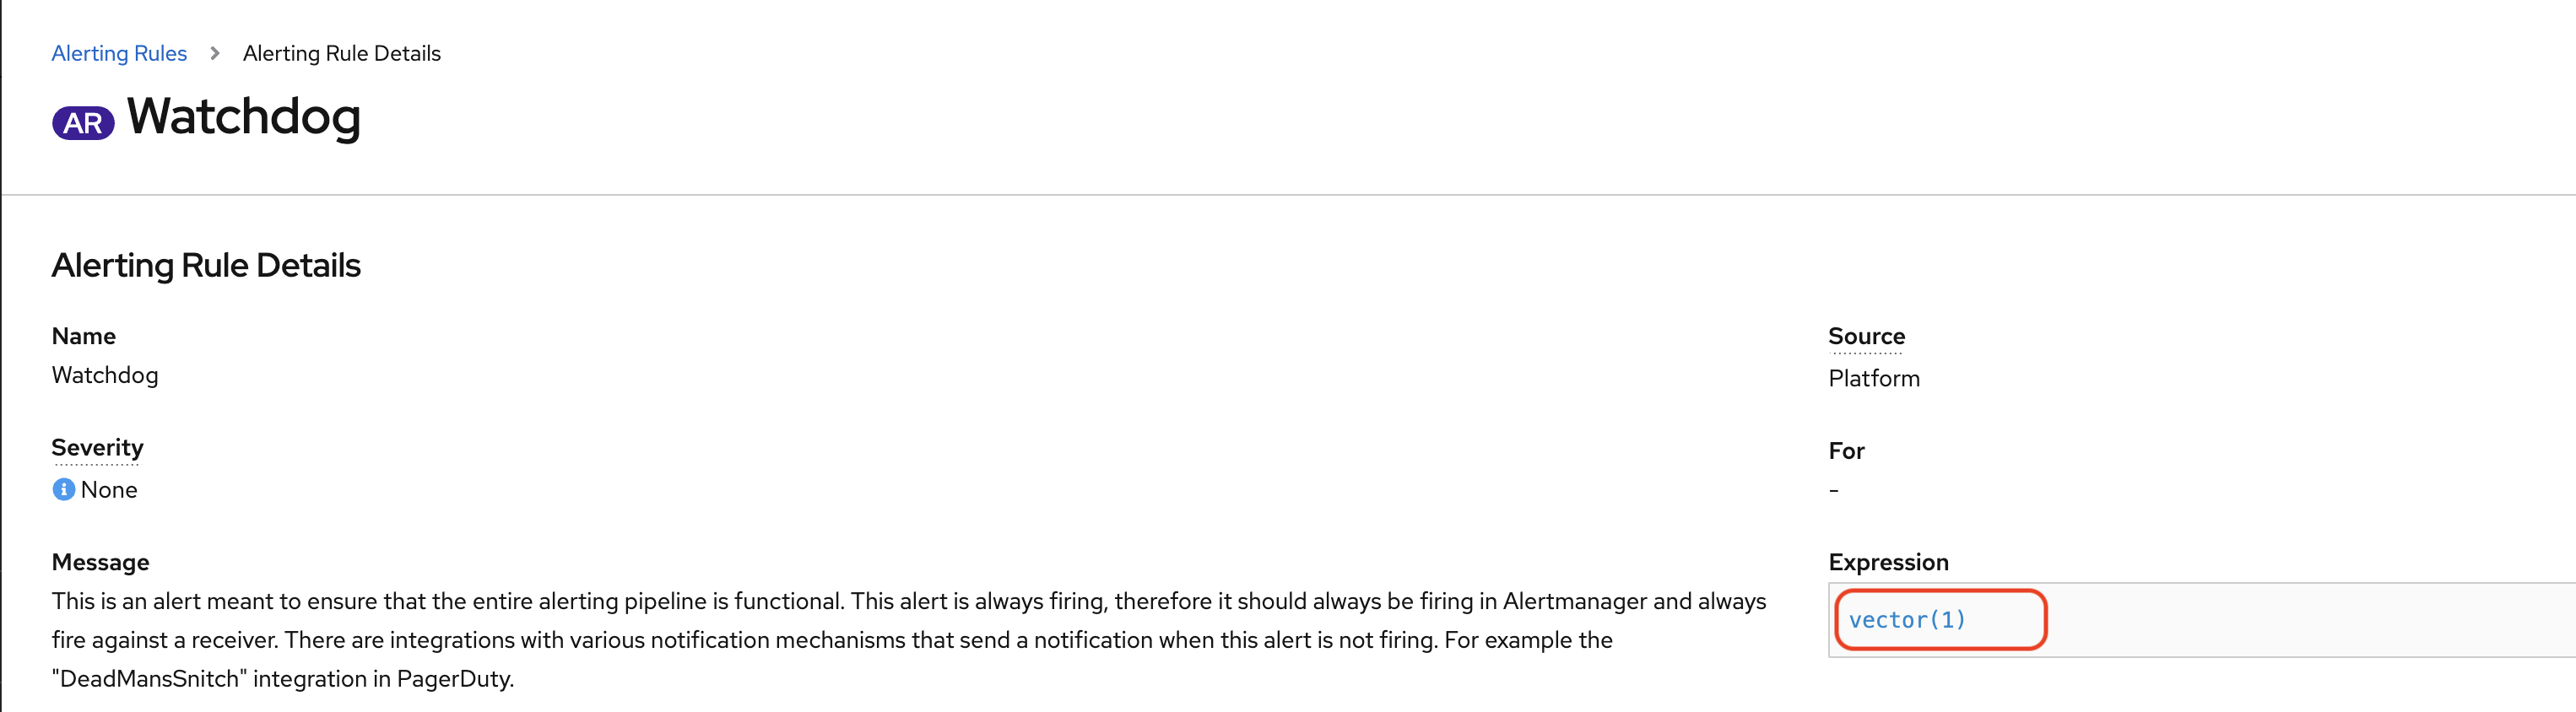
| If desired, you can click the Prometheus query embedded in the alert. Doing so will take you to the Metrics page where you will be able to execute the query for the alert and if desired make changes to the rule. |
9.2. Metrics
Click on the Metrics item as illustrated below in the Monitoring menu.
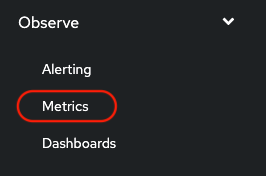
This will take you to the Metrics homepage as illustrated below.
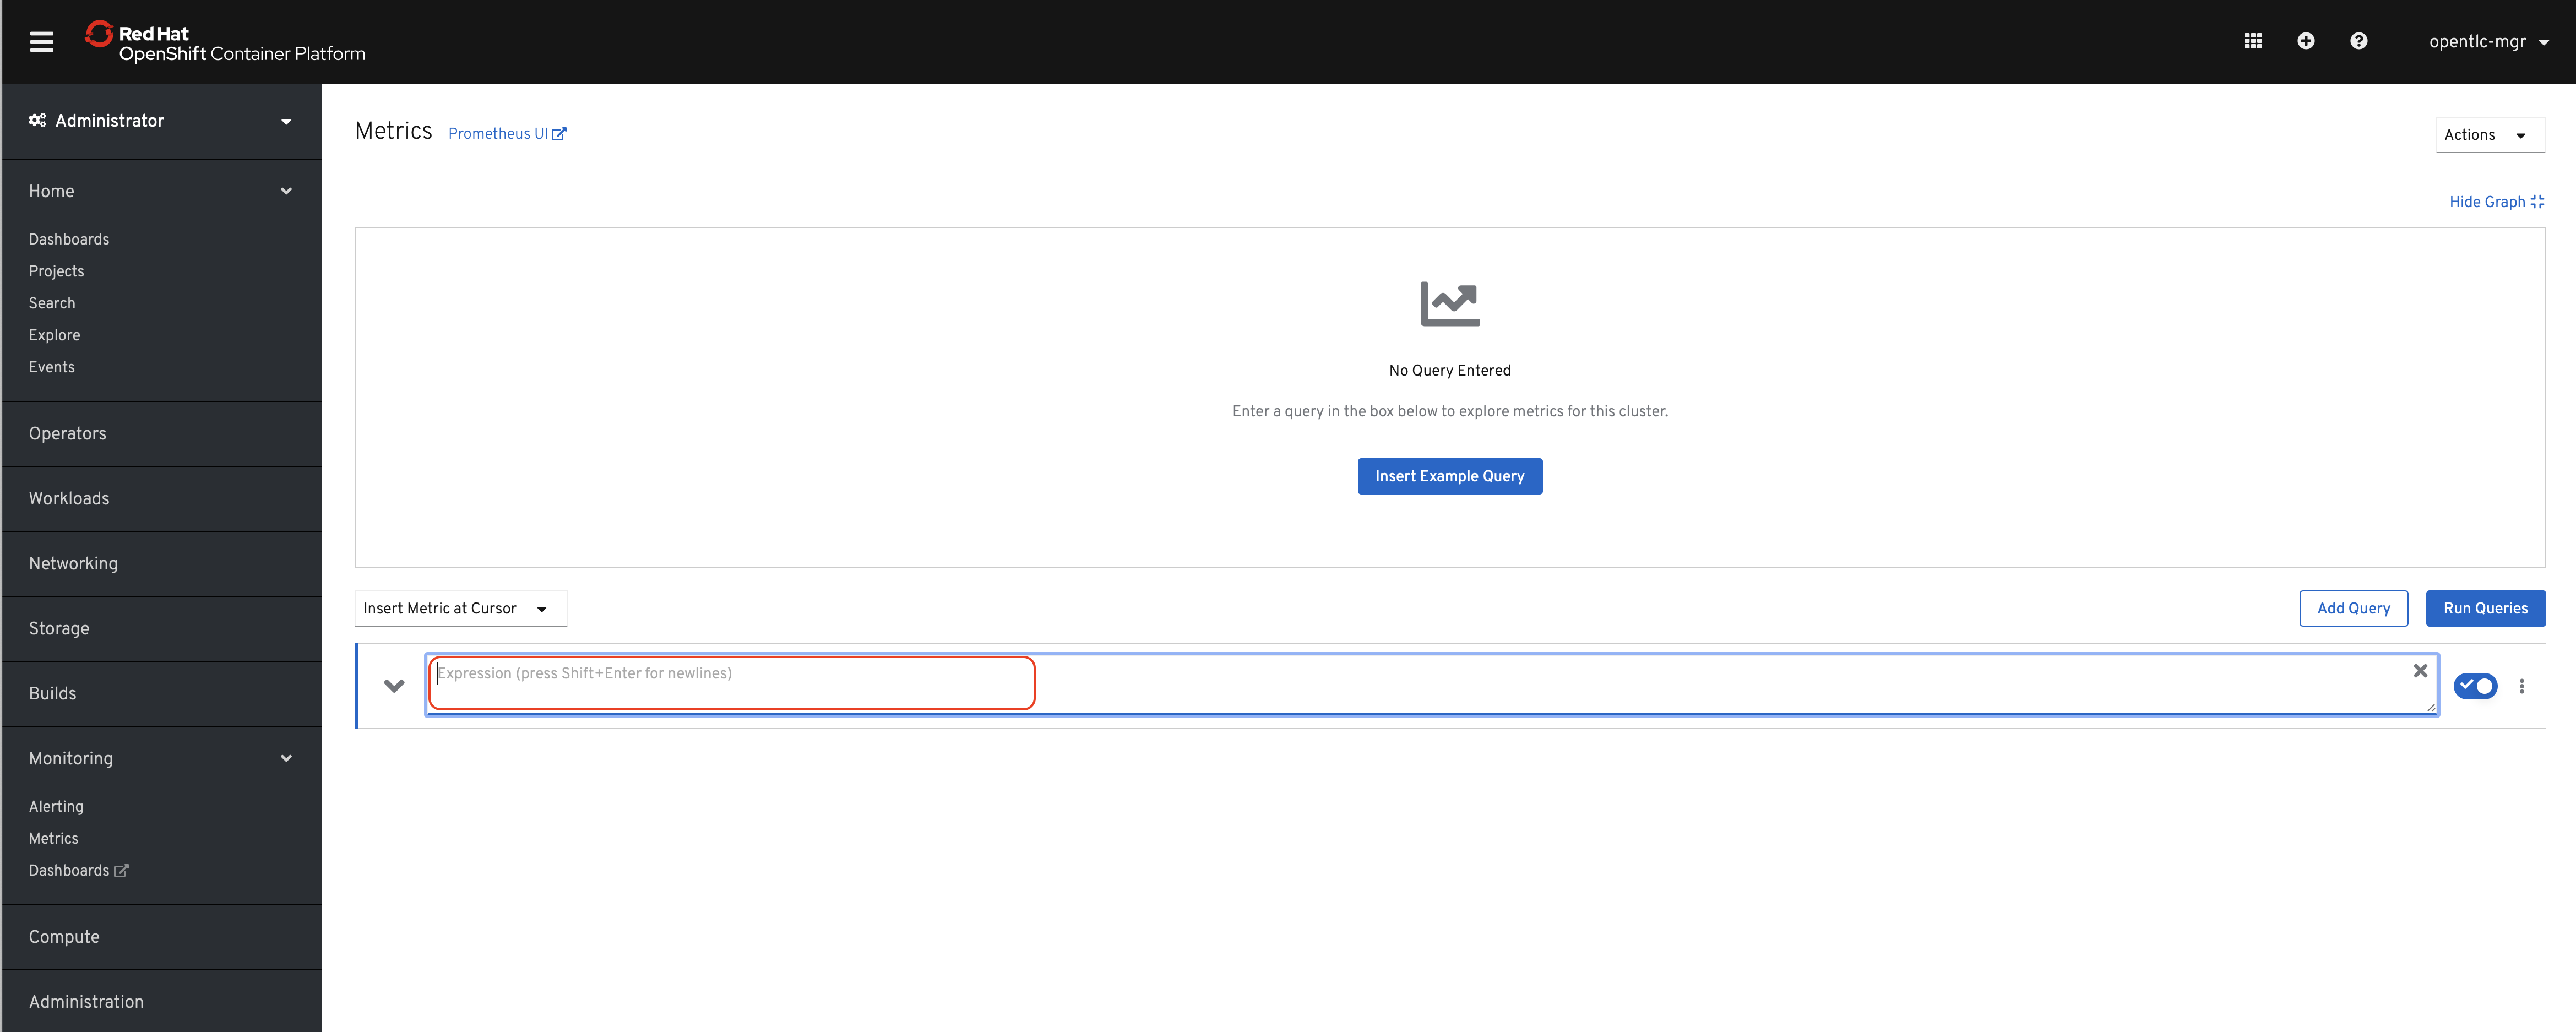
Use the query field to either enter the formula of your choice or to search for metrics by name. The metrics available will let you query both OCP related information or OCS related information. The queries can be simple or complex using the Prometheus query syntax and all its available functions.
Let’s start testing a simple query example and enter the following text
ceph_osd_op in the query field. When you are done typing, simply hit
[Enter] or select Run Queries.

The window should refresh with a graph similar to the one below.
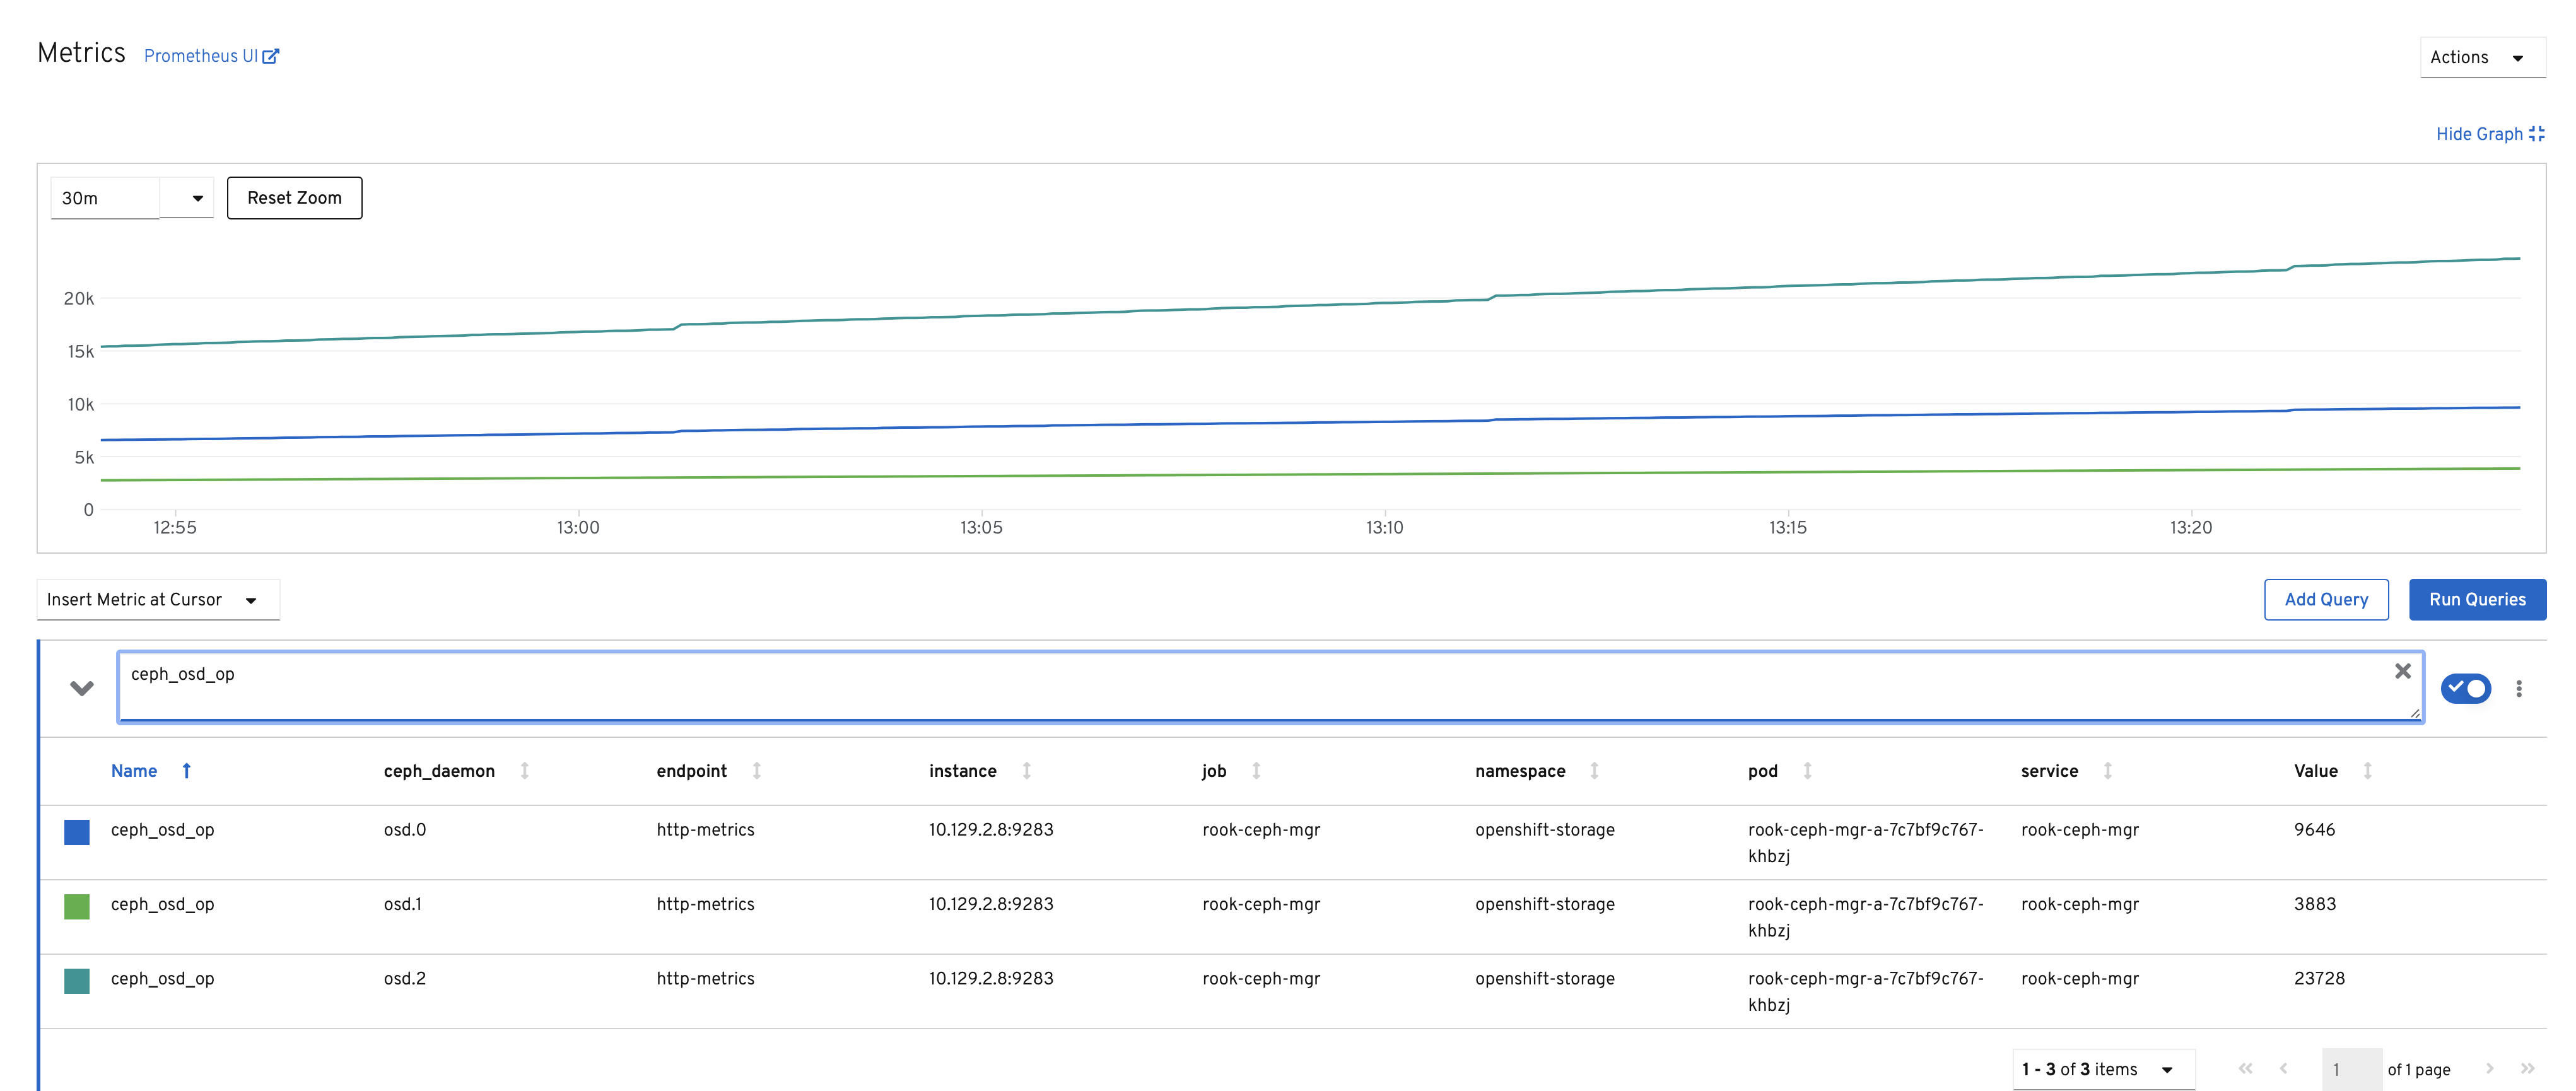
Then let’s try a more relevant query example and enter the following text
rate(ceph_osd_op[5m]) or irate(ceph_osd_op[5m]) in the query field. When
you are done typing, simply hit [Enter]`or select `Run Queries.

The window should refresh with a graph similar to the one below.
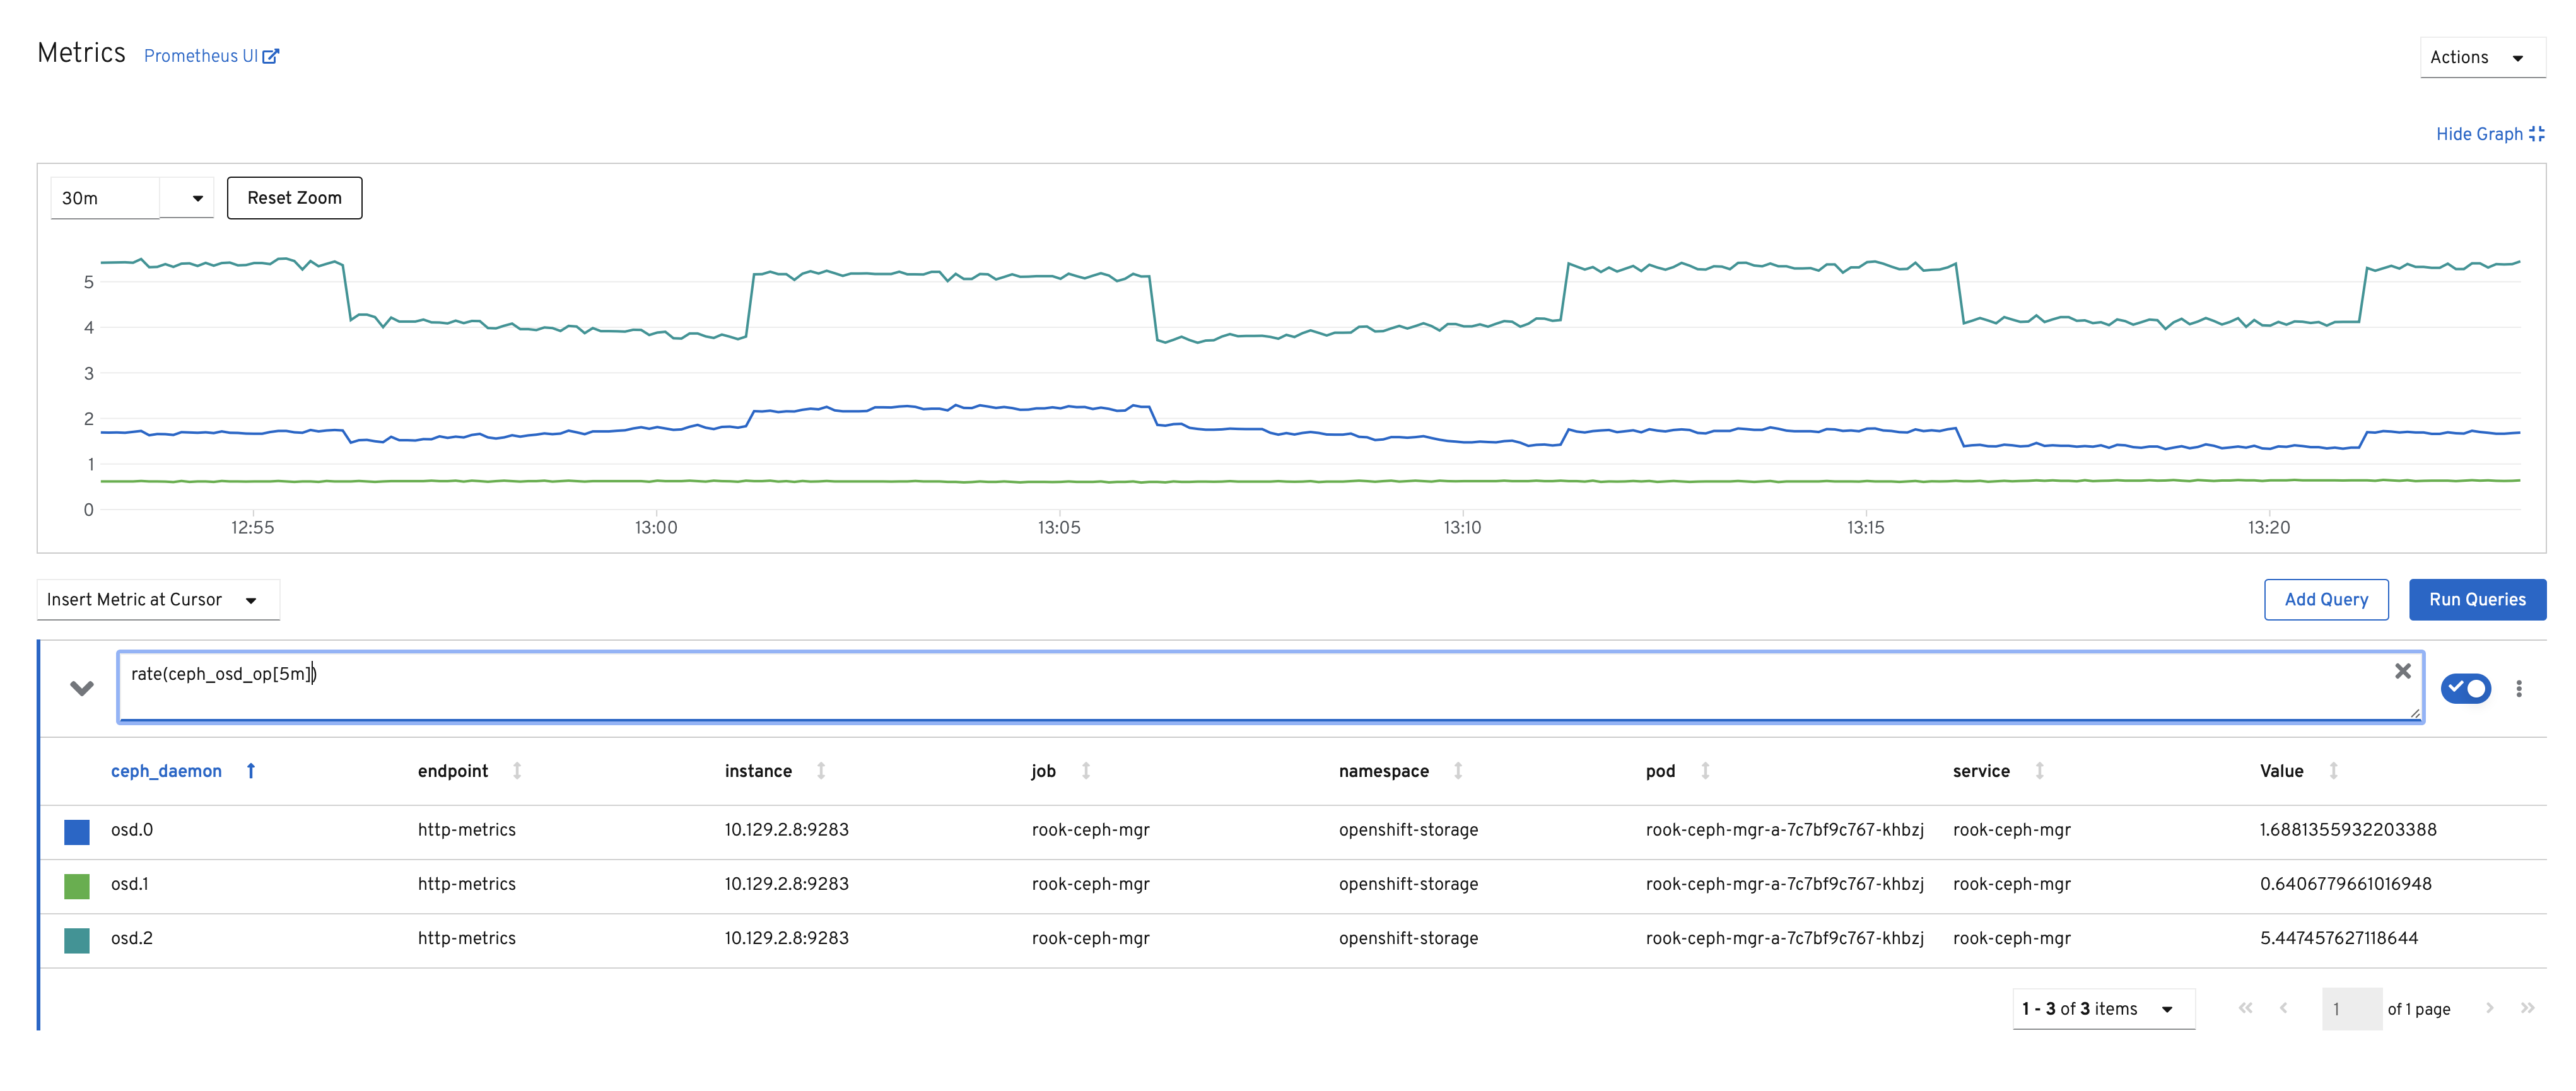
All OCP metrics are also available through the integrated Metrics window.
Feel free to try with any of the OCP related metrics such as
irate(process_cpu_seconds_total[5m]) for example.
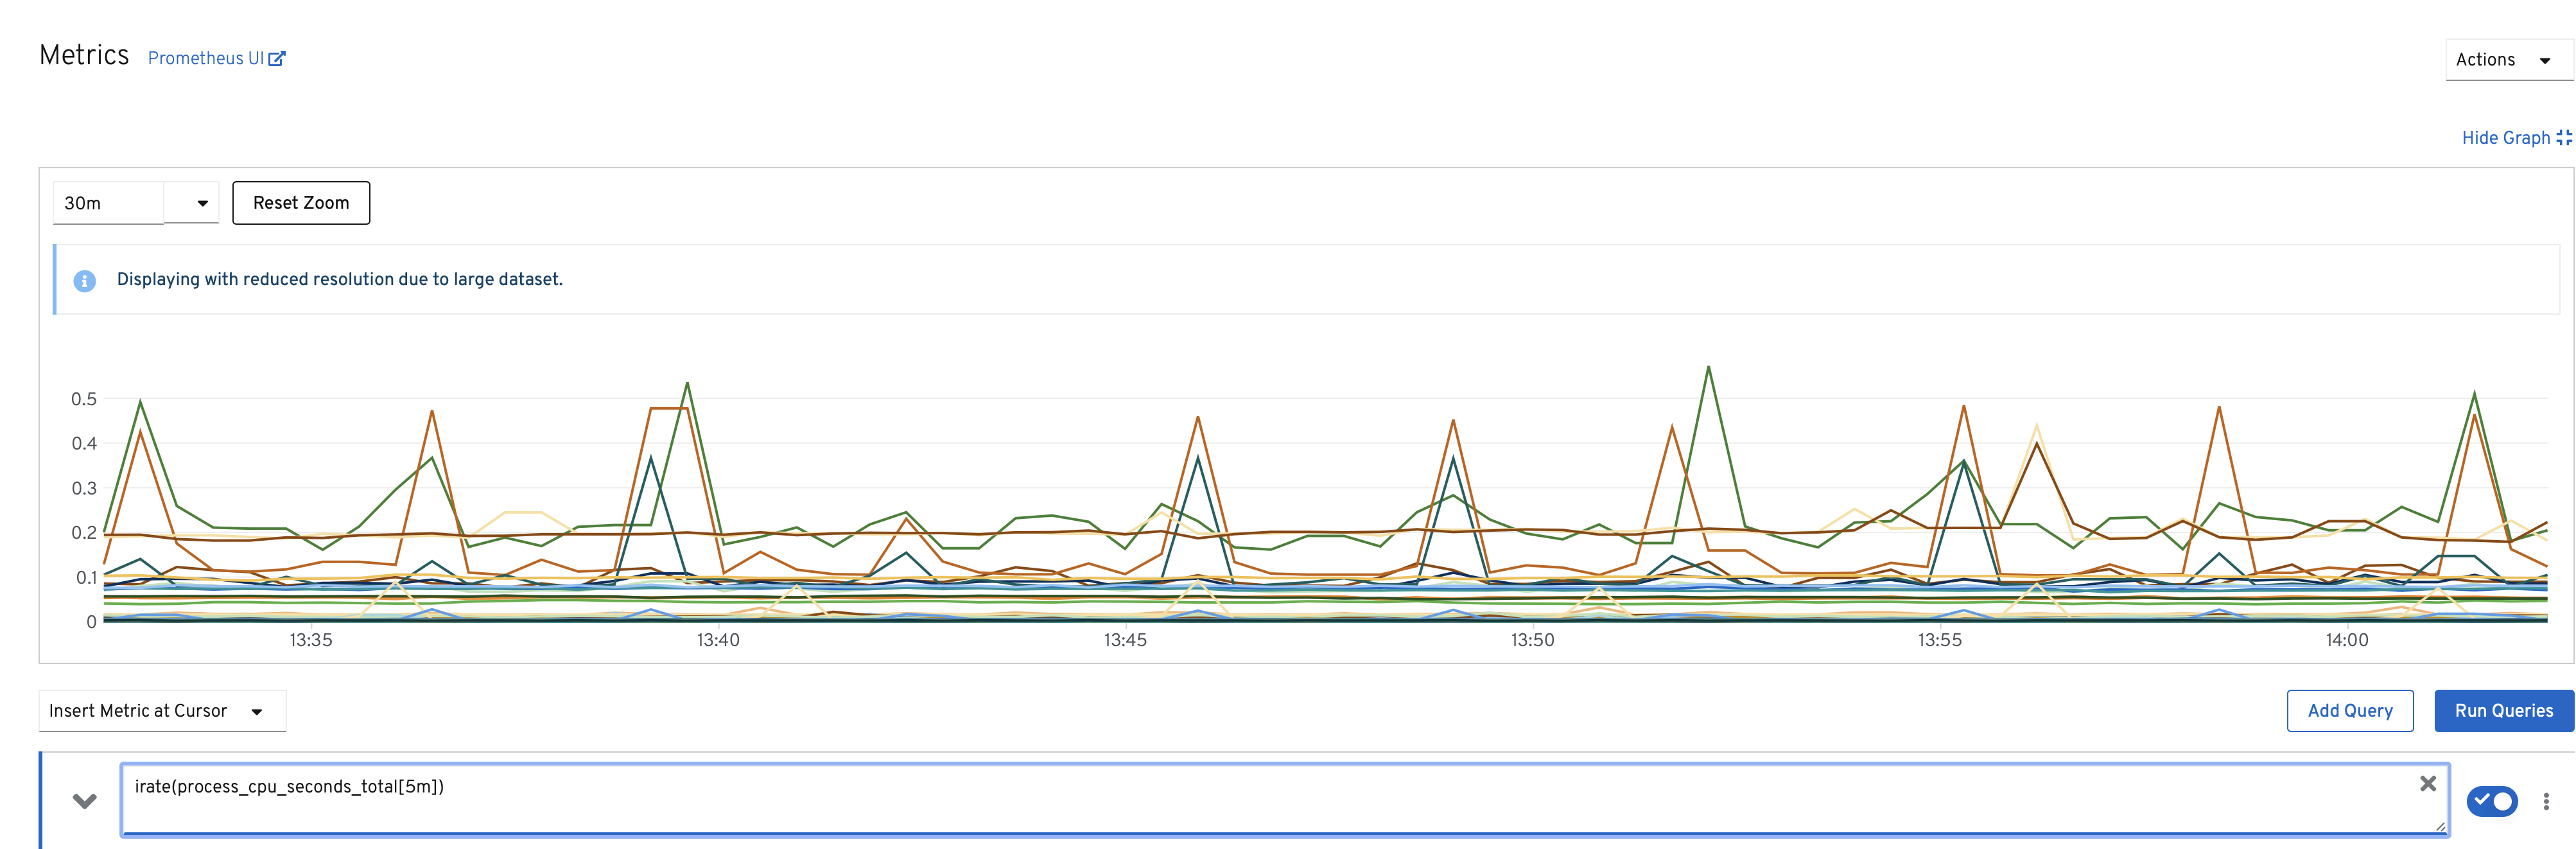
Have a look at the difference between sum(irate(process_cpu_seconds_total[5m])) and the last query irate(process_cpu_seconds_total[5m]).
| For more information on the Prometheus query language visit the Prometheus Query Documentation. |
10. Using must-gather
Must-gather is a tool for collecting data about your running Openshift cluster. It loads a predefined set of containers that execute multiple programs and write results on the local workstation’s filesystem. The local files can then be uploaded to a Red Hat case and used by a remote support engineer to debug a problem without needing direct access to your cluster. This utility and method for diagnostic collection is similar to sosreports for RHEL hosts.
The OCS team has released its own must-gather image for the must-gather tool that runs storage specific commands.
You can run this diagnostic tool like this for generic OpenShift debugging:
oc adm must-gatherOr like this for OCS specific results:
oc adm must-gather --image=registry.redhat.io/ocs4/ocs-must-gather-rhel8:v4.7The output will then be saved in the current directory inside of a new folder
called must-gather.local.(random)
More runtime options can be displayed with this command:
oc adm must-gather -hLaunch a pod to gather debugging information
This command will launch a pod in a temporary namespace on your cluster that gathers debugging information and then
downloads the gathered information.
Experimental: This command is under active development and may change without notice.
Usage:
oc adm must-gather [flags]
Examples:
# gather information using the default plug-in image and command, writing into ./must-gather.local.<rand>
oc adm must-gather
# gather information with a specific local folder to copy to
oc adm must-gather --dest-dir=/local/directory
# gather information using multiple plug-in images
oc adm must-gather --image=quay.io/kubevirt/must-gather --image=quay.io/openshift/origin-must-gather
# gather information using a specific image stream plug-in
oc adm must-gather --image-stream=openshift/must-gather:latest
# gather information using a specific image, command, and pod-dir
oc adm must-gather --image=my/image:tag --source-dir=/pod/directory -- myspecial-command.sh
Options:
--dest-dir='': Set a specific directory on the local machine to write gathered data to.
--image=[]: Specify a must-gather plugin image to run. If not specified, OpenShift's default must-gather image
will be used.
--image-stream=[]: Specify an image stream (namespace/name:tag) containing a must-gather plugin image to run.
--node-name='': Set a specific node to use - by default a random master will be used
--source-dir='/must-gather/': Set the specific directory on the pod copy the gathered data from.
Use "oc adm options" for a list of global command-line options (applies to all commands).Appendix A: Configuring the local oc client
This section will explain how you set up your workstation with the Openshift CLI.
To get the latest OpenShift CLI client run the following commands:
curl -s https://mirror.openshift.com/pub/openshift-v4/clients/ocp/latest/openshift-client-mac.tar.gz | tar xzv oc
sudo mv oc /usr/local/bin
In addition install the watch command to use with the oc client on your Mac using Homebrew.
brew install watchAlternatively, add the following lines to your $HOME/.profile.
function watch {
while :; do clear; date; echo; $@; sleep 2; done
}
Then reload your profile with source $HOME/.profile.
curl -s https://mirror.openshift.com/pub/openshift-v4/clients/ocp/latest/openshift-client-linux.tar.gz | tar xzv oc
sudo mv oc /usr/bin
Afterwards, go to your Openshift Web Console, log in and click on the
username in the top right corner. There you will find the menu item Copy Login
Command.
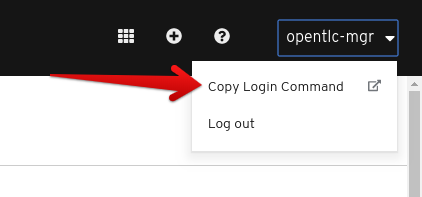
Clicking on Copy Login Command will open a new window and you might be
required to login to your Openshift cluster again. After successfully login in,
you see blue text Display token - click this and you will be shown your login
command.
The login command will look similar to this:
oc login --token=zoNoANLOOoJzXV3sb-TE1xIcg2aLBssdN0bTNIuV29w
--server=https://api.cluster-ocs-89db.ocs-89db.example.opentlc.com:6443
Execute this login command on your terminal. If you did not provision your RHPDS environment with Let’s Encrypt certificates, it will ask if you want to connect without certificate checks, accept this.
Check if you are successfully connected by issuing a command against the cluster:
oc versionClient Version: 4.7.16
Server Version: 4.7.16
Kubernetes Version: v1.20.0+2817867| The above commands will always pull the latest oc version, so your version might be higher than the version in the example output. |
Appendix B: Install the NooBaa CLI client
To install the CLI, follow these steps on your workstation:
brew install noobaa/noobaa/noobaacurl -sLO https://github.com/noobaa/noobaa-operator/releases/download/v5.9.0/noobaa-mac-v5.9.0 ; chmod +x noobaa-mac-v5.9.0 ; sudo mv noobaa-mac-v5.9.0 /usr/local/bin/noobaacurl -sLO https://github.com/noobaa/noobaa-operator/releases/download/v5.9.0/noobaa-linux-v5.9.0 ; chmod +x noobaa-linux-v5.9.0 ; sudo mv noobaa-linux-v5.9.0 /usr/bin/noobaaCheck that your noobaa CLI installation was successful with this command:
noobaa versionINFO[0000] CLI version: 5.7.0
INFO[0000] noobaa-image: noobaa/noobaa-core:5.7.0
INFO[0000] operator-image: noobaa/noobaa-operator:5.7.0Appendix C: Introduction to Ceph
This section will go through Ceph fundamental knowledge for a better understanding of the underlying storage solution used by OCS 4.
| The content in this Appendix is relevant to learning about the critical components of Ceph and how Ceph works. OCS 4 uses Ceph in a prescribed manner for providing storage to OpenShift applications. Using Operators and CustomResourceDefinitions (CRDs) for deploying and managing OCS 4 may restrict some of Ceph’s advanced features when compared to general use outside of OCP 4. |
Timeline
The Ceph project has a long history as you can see in the timeline below.
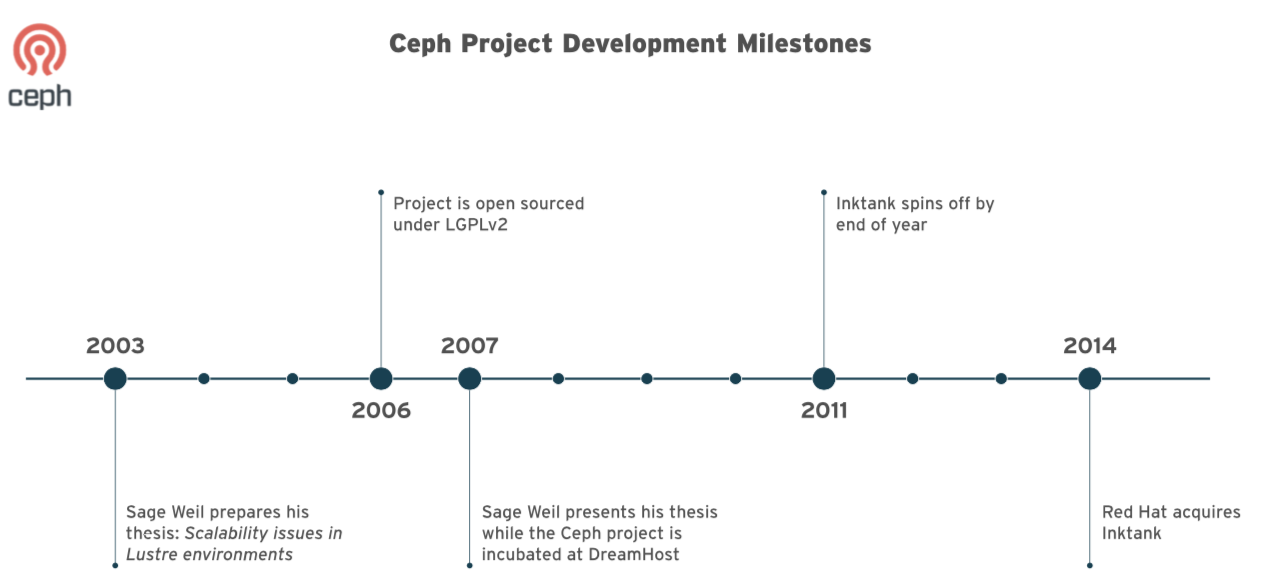
It is a battle-tested software defined storage (SDS) solution that has been available as a storage backend for OpenStack and Kubernetes for quite some time.
Architecture
The Ceph cluster provides a scalable storage solution while providing multiple access methods to enable the different types of clients present within the IT infrastructure to get access to the data.
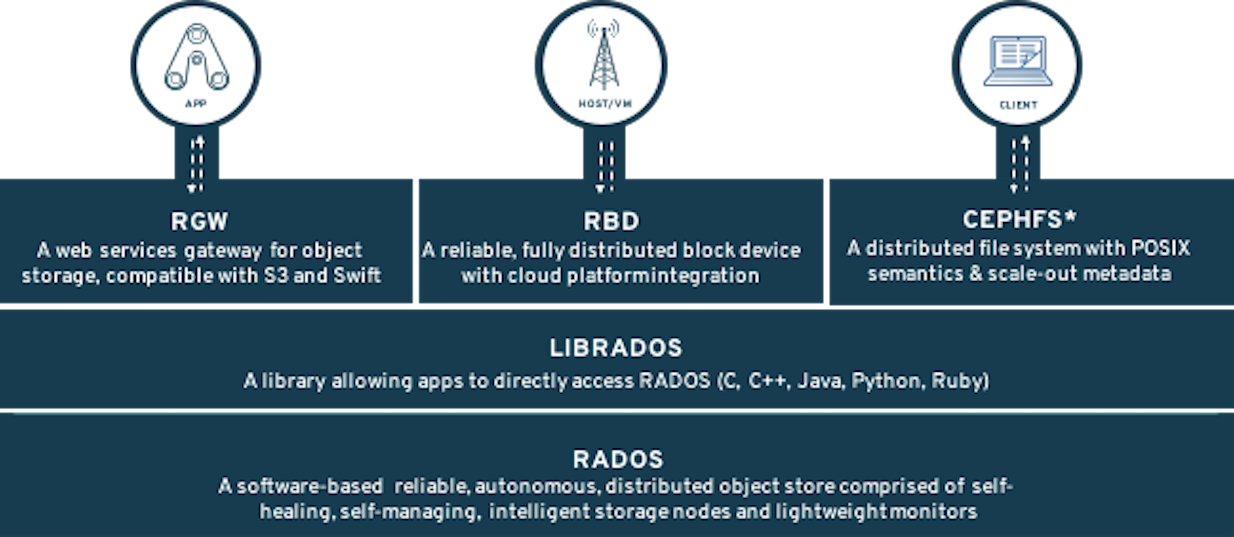
The entire Ceph architecture is resilient and does not present any single point of failure (SPOF).
RADOS
The heart of Ceph is an object store known as RADOS (Reliable Autonomic Distributed Object Store) bottom layer on the screen. This layer provides the Ceph software defined storage with the ability to store data (serve IO requests, to protect the data, to check the consistency and the integrity of the data through built-in mechanisms. The RADOS layer is composed of the following daemons:
-
MONs or Monitors
-
OSDs or Object Storage Devices
-
MGRs or Managers
-
MDSs or Meta Data Servers
The Monitors maintain the cluster map and state and provide distributed decision-making while configured in an odd number, 3 or 5 depending on the size and the topology of the cluster, to prevent split-brain situations. The Monitors are not in the data-path and do not serve IO requests to and from the clients.
One OSD is typically deployed for each local block devices and the native scalable nature of Ceph allows for thousands of OSDs to be part of the cluster. The OSDs are serving IO requests from the clients while guaranteeing the protection of the data (replication or erasure coding), the rebalancing of the data in case of an OSD or a node failure, the coherence of the data (scrubbing and deep-scrubbing of the existing data).
The Managers are tightly integrated with the Monitors and collect the statistics within the cluster. Additionally they provide an extensible framework for the cluster through a pluggable Python interface aimed at expanding the Ceph existing capabilities. The current list of modules developed around the Manager framework are:
-
Balancer module
-
Placement Group auto-scaler module
-
Dashboard module
-
RESTful module
-
Prometheus module
-
Zabbix module
-
Rook module
The Meta Data Servers manage the metadata for the POSIX compliant shared filesystem such as the directory hierarchy and the file metadata (ownership, timestamps, mode, …). All the metadata is stored with RADOS and they do not server any data to the clients. MDSs are only deployed when a shared filesystem is configured in the Ceph cluster.
If we look at the Ceph cluster foundation layer, the full picture with the different types of daemons or containers looks like this.

The circle represent the MONs, the 'M' represent the MGRs and the squares with the bars represent the OSDs. In the diagram above, the cluster operates with 3 Monitors, 2 Managers and 23 OSDs.
Access Methods
Ceph was designed to provides the IT environment with all the necessary access methods so that any application can use what is the best solution for its use-case.
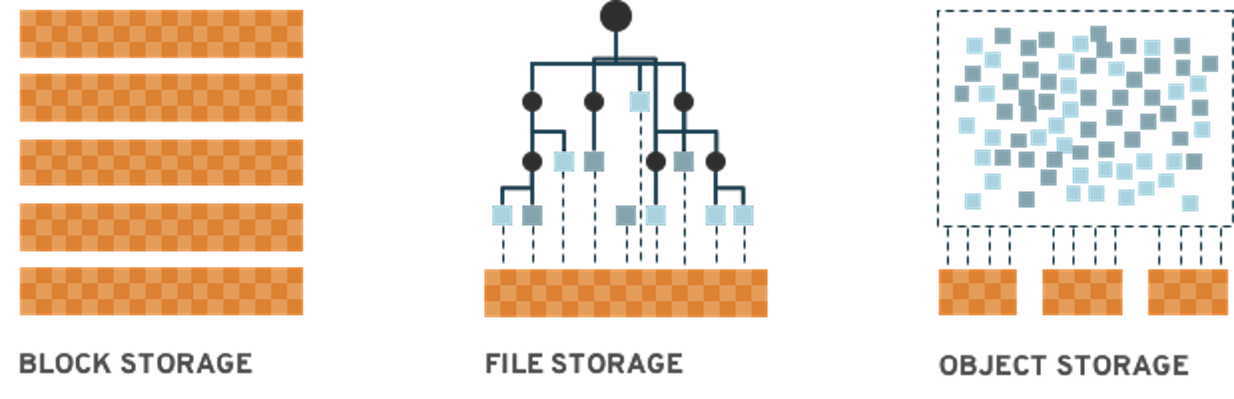
Ceph supports block storage through the RADOS Block Device (aka RBD) access
method, file storage through the Ceph Filesystem (aka CephFS) access method
and object storage through its native librados API or through the RADOS
Gateway (aka RADOSGW or RGW) for compatibility with the S3 and Swift
protocols.
Librados
Librados allows developers to code natively against the native Ceph cluster API for maximum efficiency combined with a small footprint.
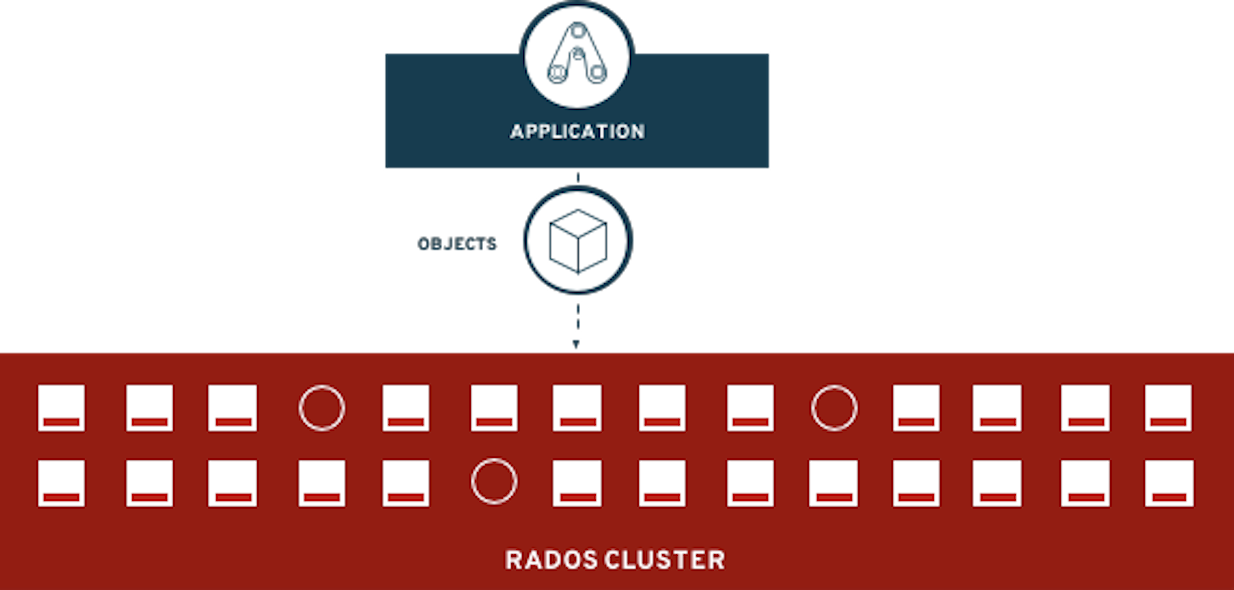
The Ceph native API offers different wrappers such as C, C++, Python, Java, Ruby, Erlang, Go and Rust.
RADOS Block Device (RBD)
This access method is used in Red Hat Enterprise Linux or OpenShift version
3.x or 4.x. RBDs can be accessed either through a kernel module (RHEL, OCS4)
or through the librbd API (RHOSP). In the OCP world, RBDs are designed to
address the need for RWO PVCs.
Kernel Module (kRBD)
The kernel RBD driver offers superior performance compared to the userspace
librbd method. However, kRBD is currently limited and does not provide the
same level of functionality. e.g., no RBD Mirroring support.
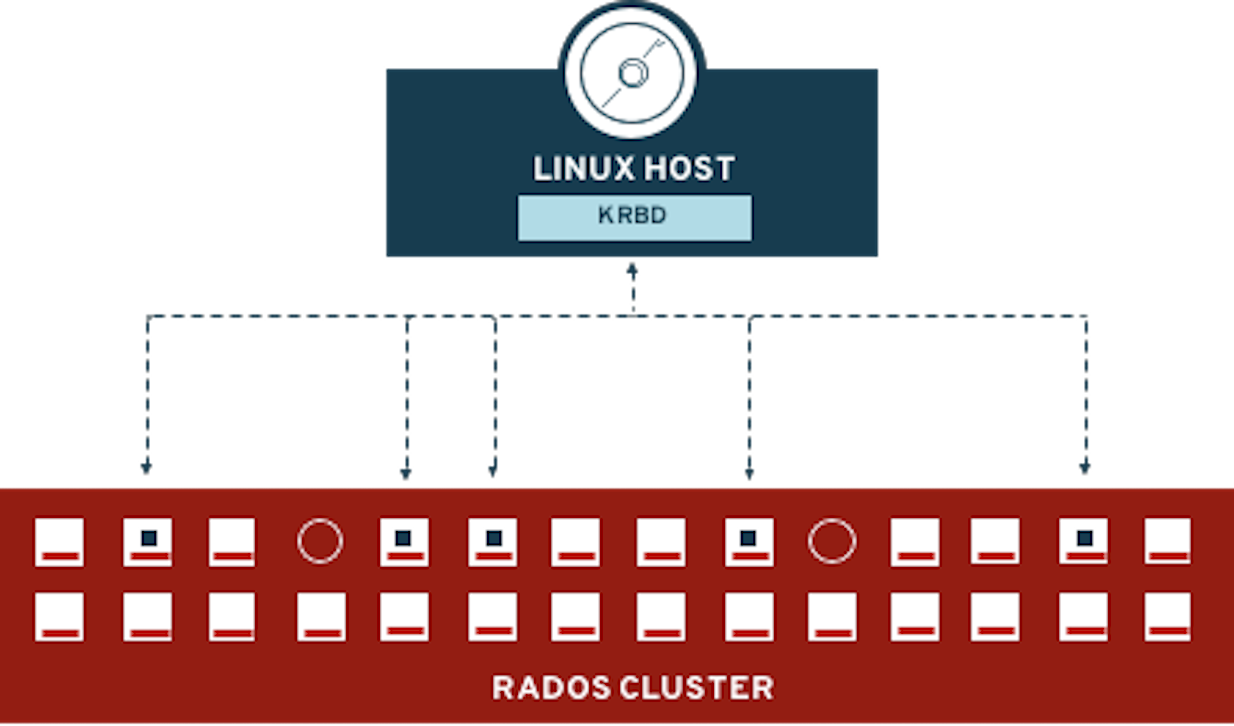
Userspace RBD (librbd)
This access method is used in Red Hat OpenStack Environment or OpenShift through the RBD-NBD driver when available starting in the RHEL 8.1 kernel. This mode allows us to leverage all existing RBD features such as RBD Mirroring.
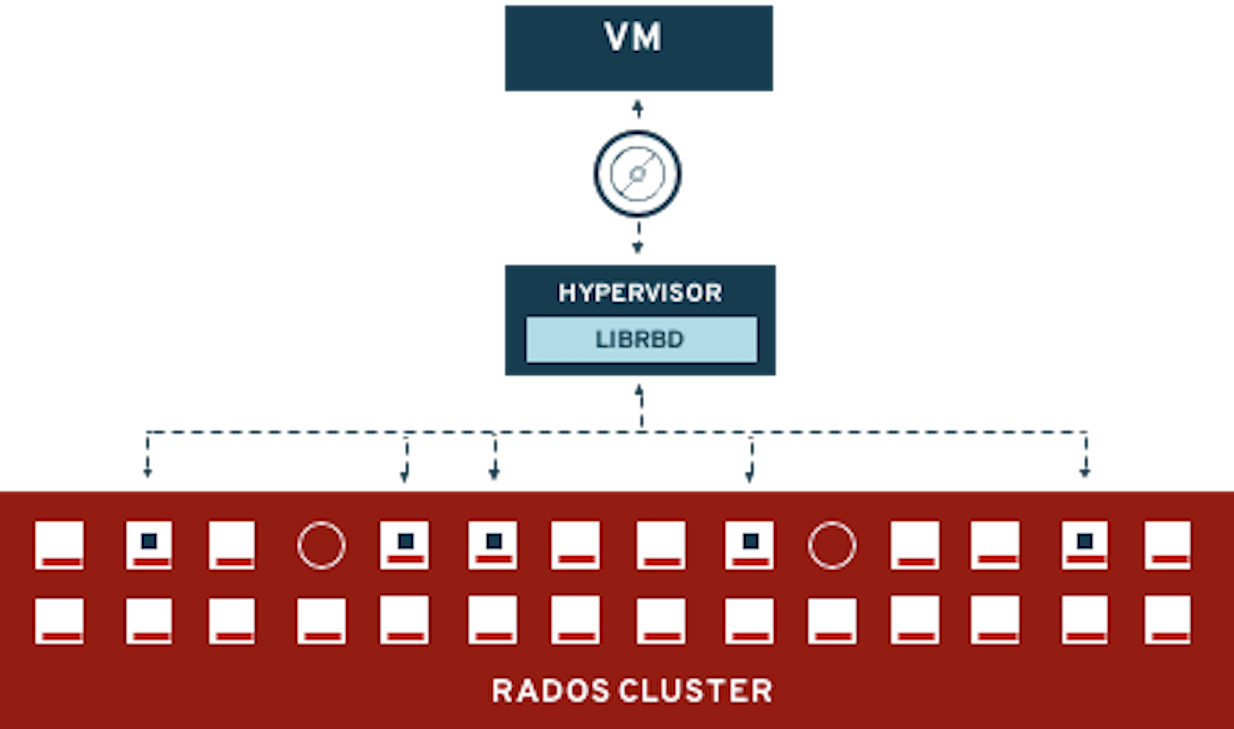
Shared Filesystem (CephFS)
This method allows clients to jointly access a shared POSIX compliant filesystem. The client initially contacts the Meta Data Server to obtain the location of the object(s) for a given inode and then communicates directly with an OSD to perform the final IO request.
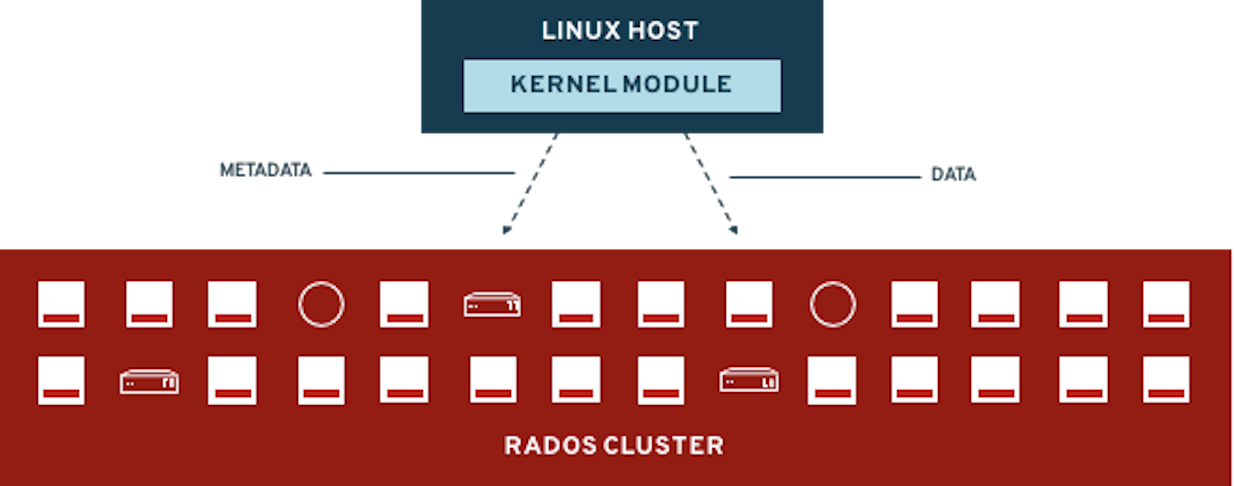
CephFS is typically used for RWX claims but can also be used to support RWO claims.
Object Storage, S3 and Swift (Ceph RADOS Gateway)
This access method offers support for the Amazon S3 and OpenStack Swift support on top of a Ceph cluster. The Openshift Container Storage Multi Cloud Gateway can leverage the RADOS Gateway to support Object Bucket Claims. From the Multi Cloud Gateway perspective the RADOS Gateway will be tagged as a compatible S3 endpoint.
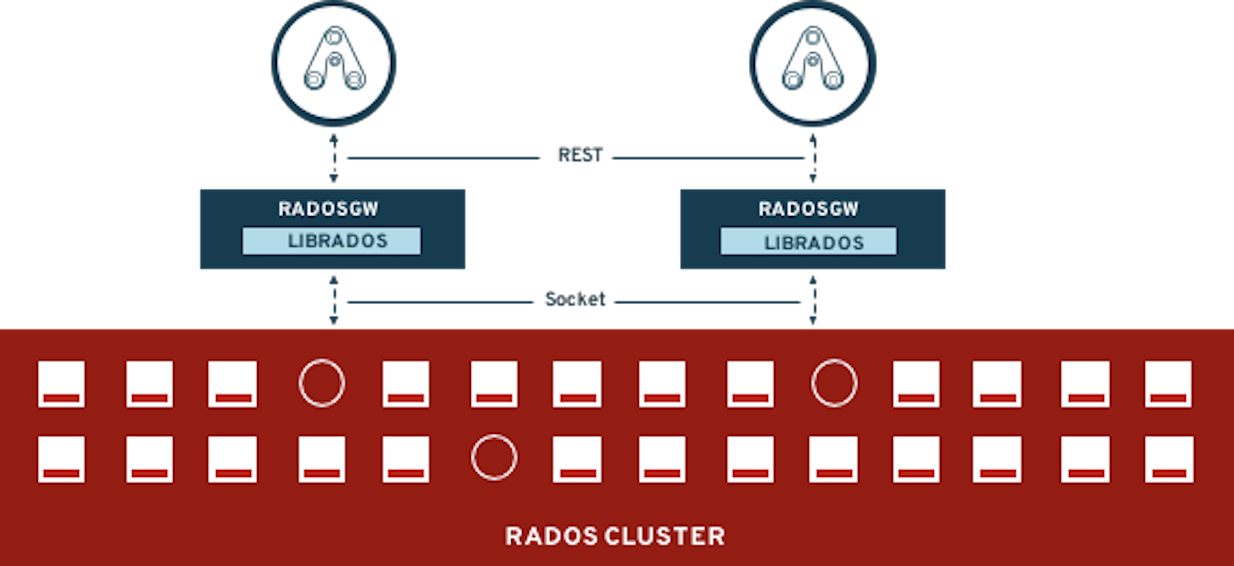
CRUSH
The Ceph cluster being a distributed architecture some solution had to be designed to provide an efficient way to distribute the data across the multiple OSDs in the cluster. The technique used is called CRUSH or Controlled Replication Under Scalable Hashing. With CRUSH, every object is assigned to one and only one hash bucket known as a Placement Group (PG).
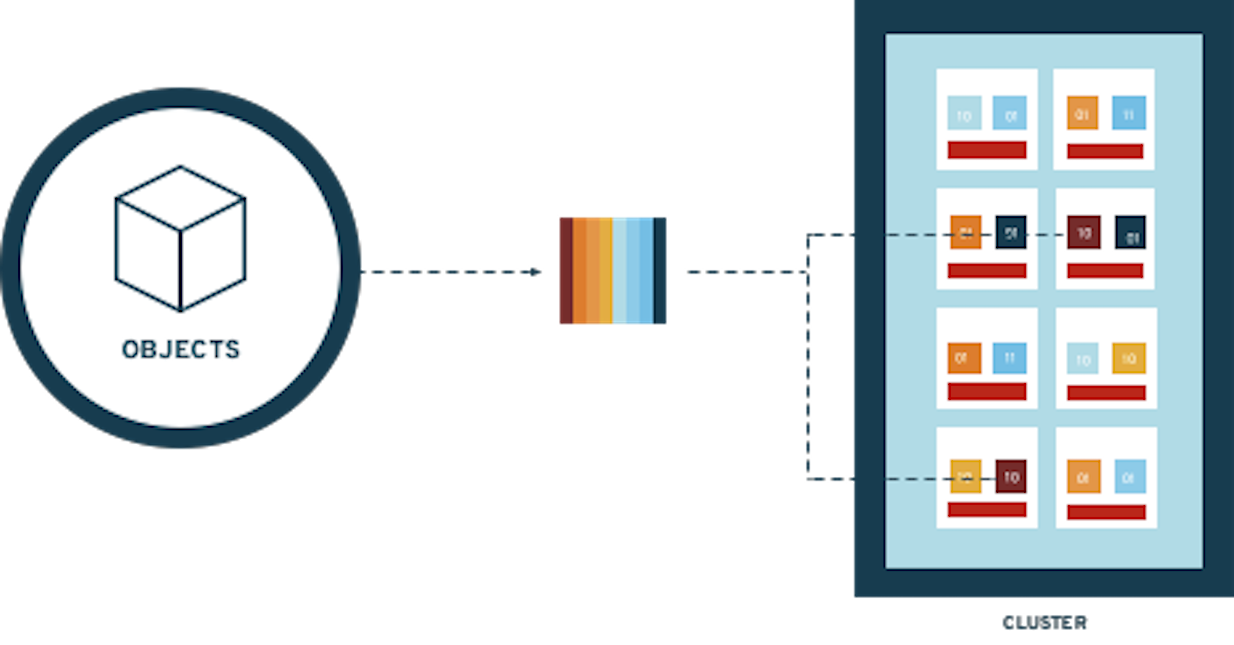
CRUSH is the central point of configuration for the topology of the cluster. It offers a pseudo-random placement algorithm to distribute the objects across the PGs and uses rules to determine the mapping of the PGs to the OSDs. In essence, the PGs are an abstraction layer between the objects (application layer) and the OSDs (physical layer). In case of failure, the PGs will be remapped to different physical devices (OSDs) and eventually see their content resynchronized to match the protection rules selected by the storage administrator.
Cluster Partitioning
The Ceph OSDs will be in charge of the protection of the data as well as the constant checking of the integrity of the data stored in the entire cluster. The cluster will be separated into logical partitions, known as pools. Each pool has the following properties that can be adjusted:
-
An ID (immutable)
-
A name
-
A number of PGs to distribute the objects across the OSDs
-
A CRUSH rule to determine the mapping of the PGs for this pool
-
A type of protection (Replication or Erasure Coding)
-
Parameters associated with the type of protection
-
Number of copies for replicated pools
-
K and M chunks for Erasure Coding
-
-
Various flags to influence the behavior of the cluster
Pools and PGs
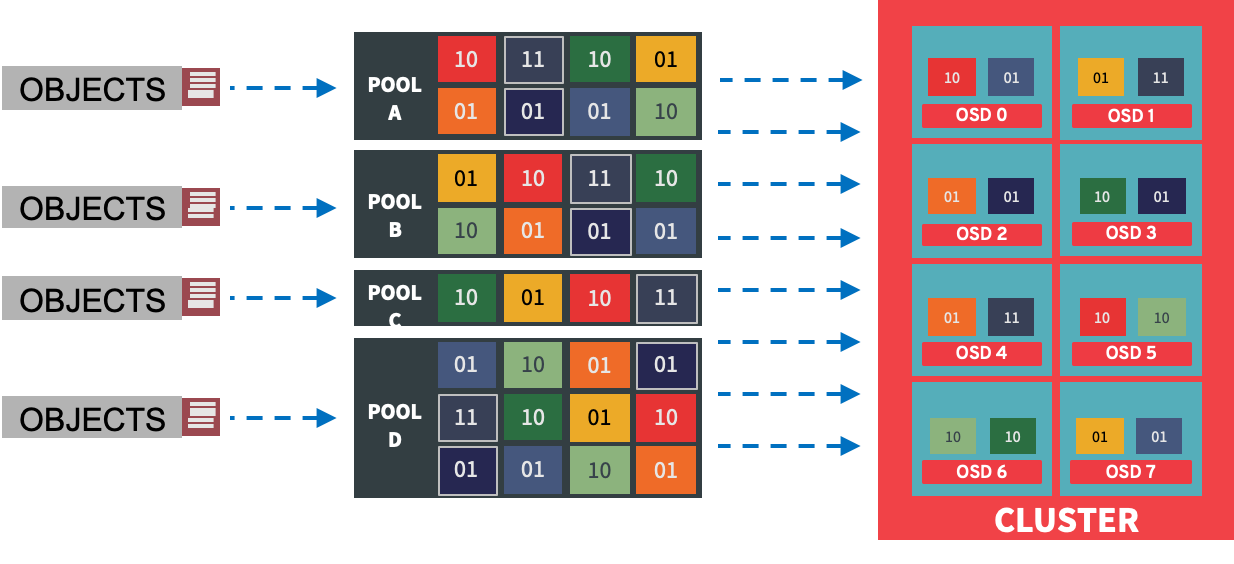
The diagram above shows the relationship end to end between the object at the access method level down to the OSDs at the physical layer.
| A Ceph pool has no size and is able to consume the space available on any OSD where it’s PGs are created. A Placement Group or PG belongs to only one pool. |
Data Protection
Ceph supports two types of data protection presented in the diagram below.
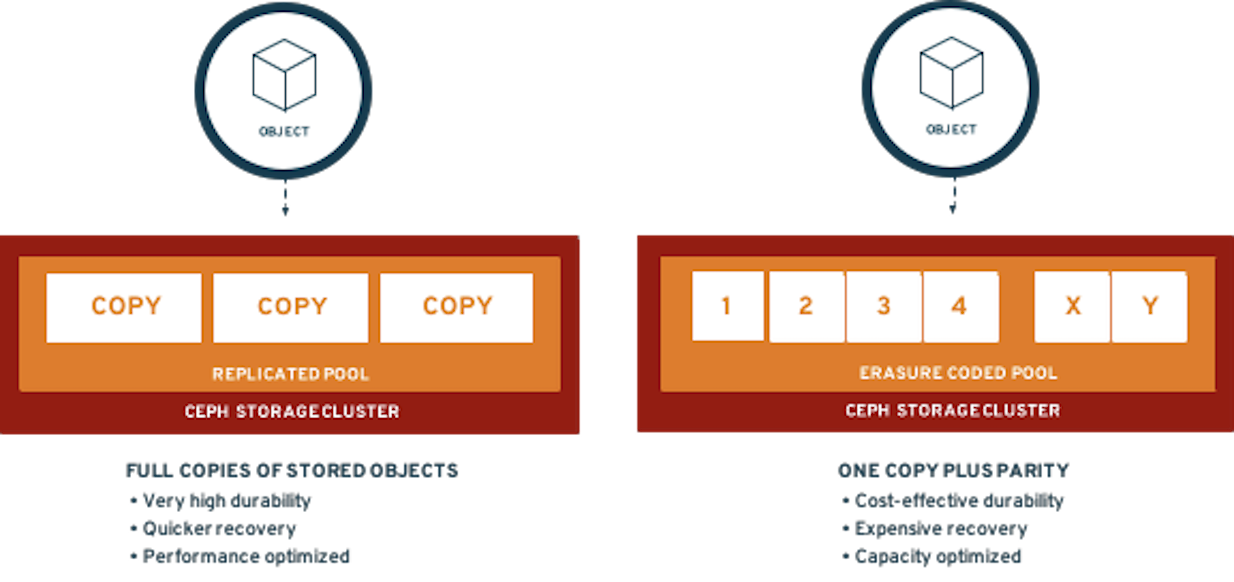
Replicated pools provide better performance in almost all cases at the cost
of a lower usable to raw storage ratio (1 usable byte is stored using 3 bytes
of raw storage) while Erasure Coding provides a cost efficient way to store
data with less performance. Red Hat supports the following Erasure Coding
profiles with their corresponding usable to raw ratio:
-
4+2 (1:2 ratio)
-
8+3 (1:1.375 ratio)
-
8+4 (1:2 ratio)
Another advantage of Erasure Coding (EC) is its ability to offer extreme
resilience and durability as we can configure the number of parities being
used. EC can be used for the RADOS Gateway access method and for the RBD
access method (performance impact).
Data Distribution
To leverage the Ceph architecture at its best, all access methods but librados, will access the data in the cluster through a collection of objects. Hence a 1GB block device will be a collection of objects, each supporting a set of device sectors. Therefore, a 1GB file is stored in a CephFS directory will be split into multiple objects. Also a 5GB S3 object stored through the RADOS Gateway via the Multi Cloud Gateway will be divided in multiple objects.
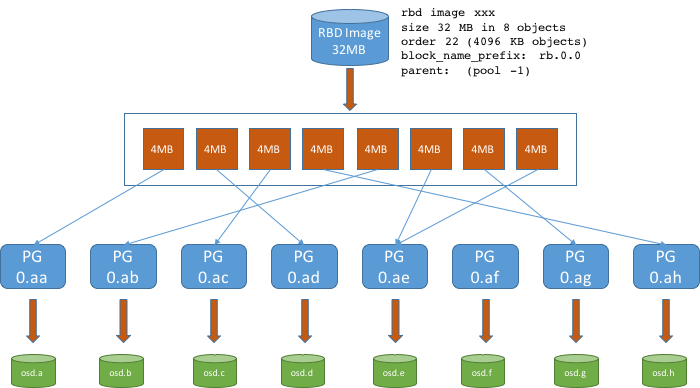
| By default, each access method uses an object size of 4MB. The above diagram details how a 32MB RBD (Block Device) supporting a RWO PVC will be scattered throughout the cluster. |